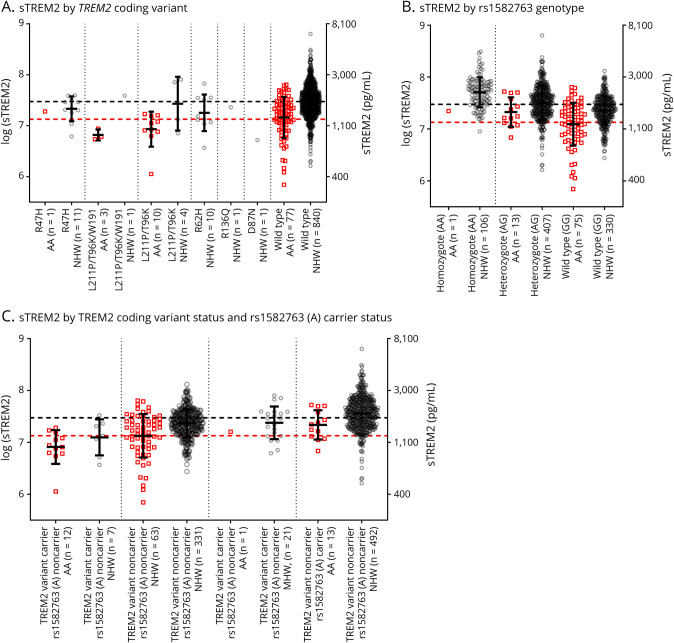
Figure 2. Differences in CSF sTREM2 Levels in the Knight Alzheimer Disease Research Center Cohort by Self-Reported Race.
The natural logarithm of CSF concentrations of soluble triggering receptor expressed on myeloid cells 2 (sTREM2) was plotted as a function of TREM2 coding variant (A), MS4A4A rs1582763 genotype (B), or TREM2 coding variant status and MS4A4A rs1582763 (A) carrier status (C). For all plots, the corresponding sTREM2 concentrations in pg/mL are shown on the right axis. Red squares represent samples from African Americans (AAs), and gray circles represent samples from non-Hispanic Whites (NHWs). Horizontal dashed lines indicate the mean sTREM2 levels for AA (red) and NHW (gray) groups. Vertical dotted lines separate genetic groups. The number of individuals in each group is listed (n).

