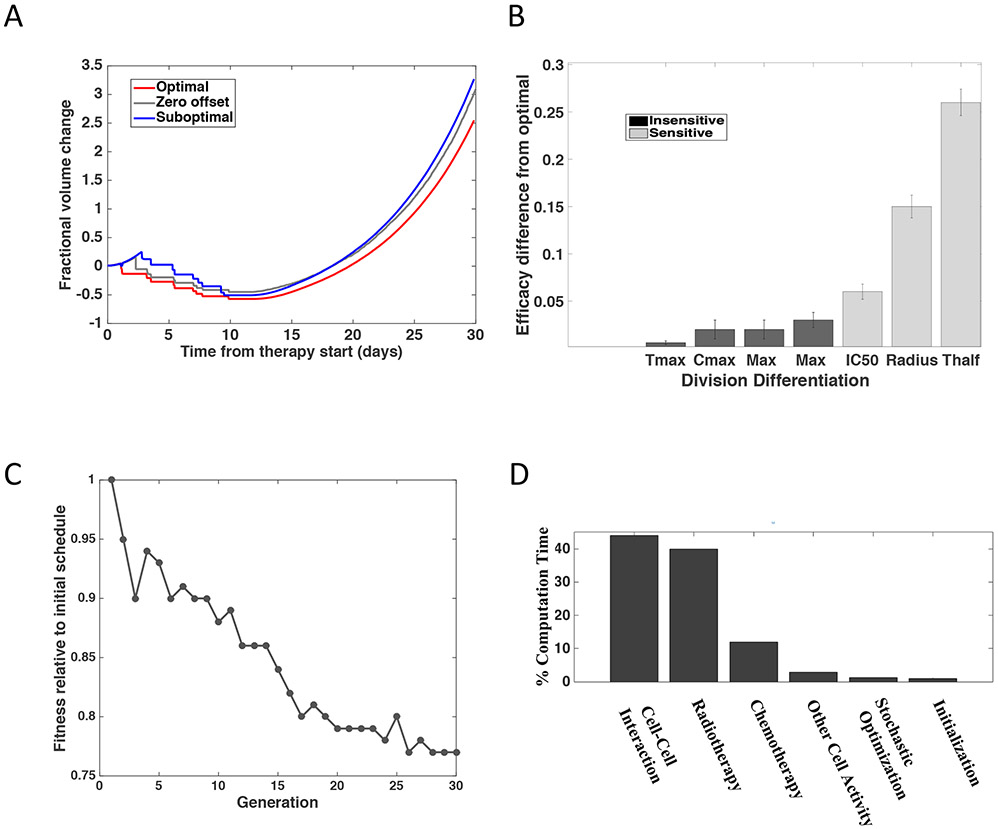
Fig. 3 ∣. Prediction of responses to different chemoradiation administration schedules.
(A) Prediction plots showing the expected fractional volume change over time for the optimized versus suboptimal and zero offset treatment schedules from (A). To account for stochasticity, the simulations were run 128 times to create the technical replicates required to account for stochasticity of the model. The dashed lines show the standard error. The differences in expansion as defined by increase in fractional volume are significantly different with a mean fractional volume change of 3.67 for the optimal schedule and 4.72 for the suboptimal schedule (p < 0.0001, two-sided t-test). (B) Sensitivity analysis of the model’s parameters, ranked from most to least sensitive, as determined by the sensitivity analysis in Figure S1. The variables that demonstrated a significant impact when varied +/− 30% are shown in light grey (p < 0.0001, two-sided t-test) whereas those with no significant impact are shown in black (p < 0.0001, two-sided t-test). (C) Relative fitness across stochastic optimization generations. Each generation consisted of 1024 different schedules being tested with 128 instances of each schedule. These instances provided the technical replicates required to account for stochasticity of the model. (D) Percent of time spent in each component of the 36 million compute hours on the IBM Blue Gene/Q supercomputer.

