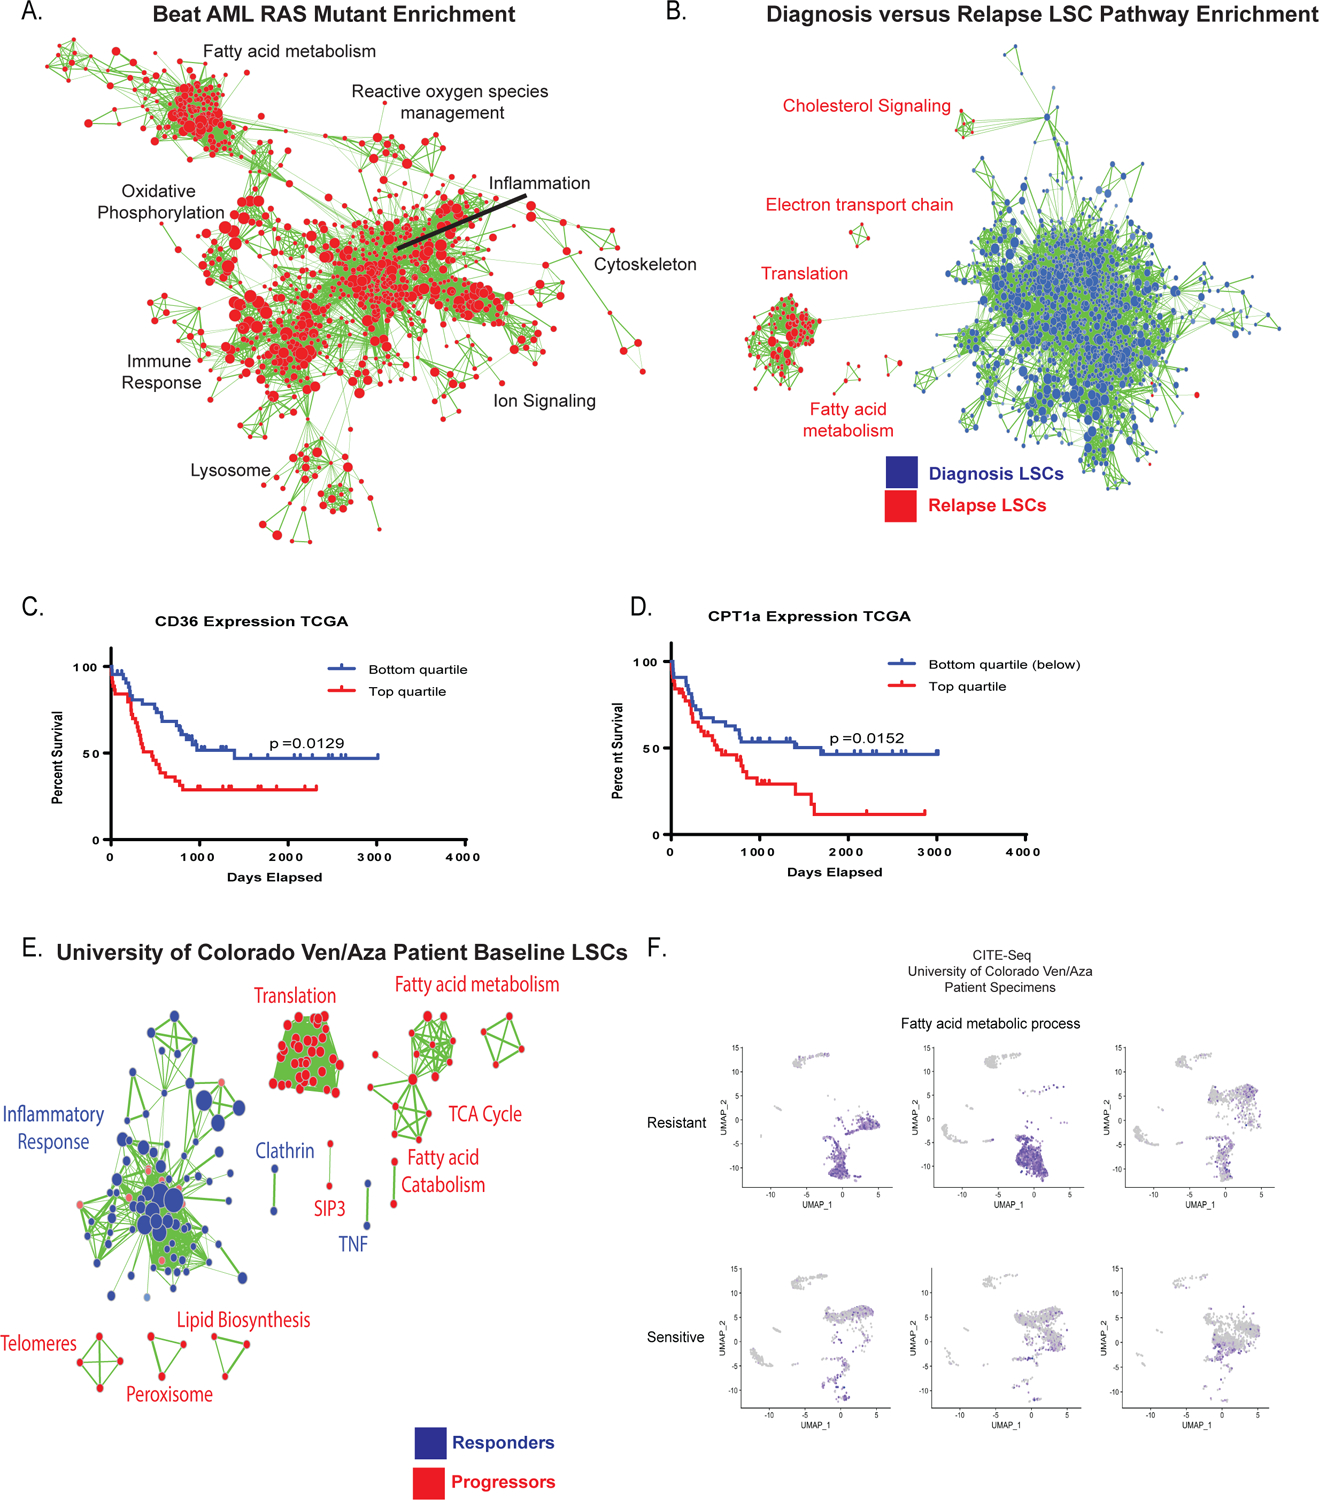
Figure 5: Transcriptional analysis of fatty acid metabolism genes correlates with clinical resistance to ven/aza.

A. Transcriptional analysis of RAS pathway mutant specimens from Beat AML data shows enrichment of gene sets involved in fatty acid metabolism, oxidative phosphorylation, lysosome, and reactive oxygen species management (red colored nodes indicate genes/pathways upregulated in RAS pathway mutations). N= 451 total patients with 78 mutant patients and 373 WT patients. B. Transcriptional analysis of diagnosis and relapse paired specimen LSCs shows enrichment of gene sets involved in fatty acid metabolism and TCA cycle. N= 8 diagnosis LSC samples and N= 15 relapse samples C. Survival analysis of lowest and highest quartile expression of CD36 in the TCGA data set. Significance was measured with Log- Rank (Mantel-Cox) test. N= 45 patients in top and N=46 patients in bottom quartile. D. Survival analysis of lowest and highest quartile expression of CPT1a in TCGA data set. Significance was measured with Log- Rank (Mantel-Cox) test. N= 45 patients in top and N=46 patients in bottom quartile. E. Transcriptional analysis of baseline LSCs from patients undergoing ven/aza therapy shows enrichment of gene sets involved in fatty acid metabolism and TCA cycle in patients that progress on therapy versus long term responders N= 9 patients (6 responders/3 progressors). F. CITE-seq analysis of 3 ven/aza sensitive and 3 ven/aza resistant patients reveals significantly different transcriptional profiles with enrichment in fatty acid metabolism in non-responder patient cells.
