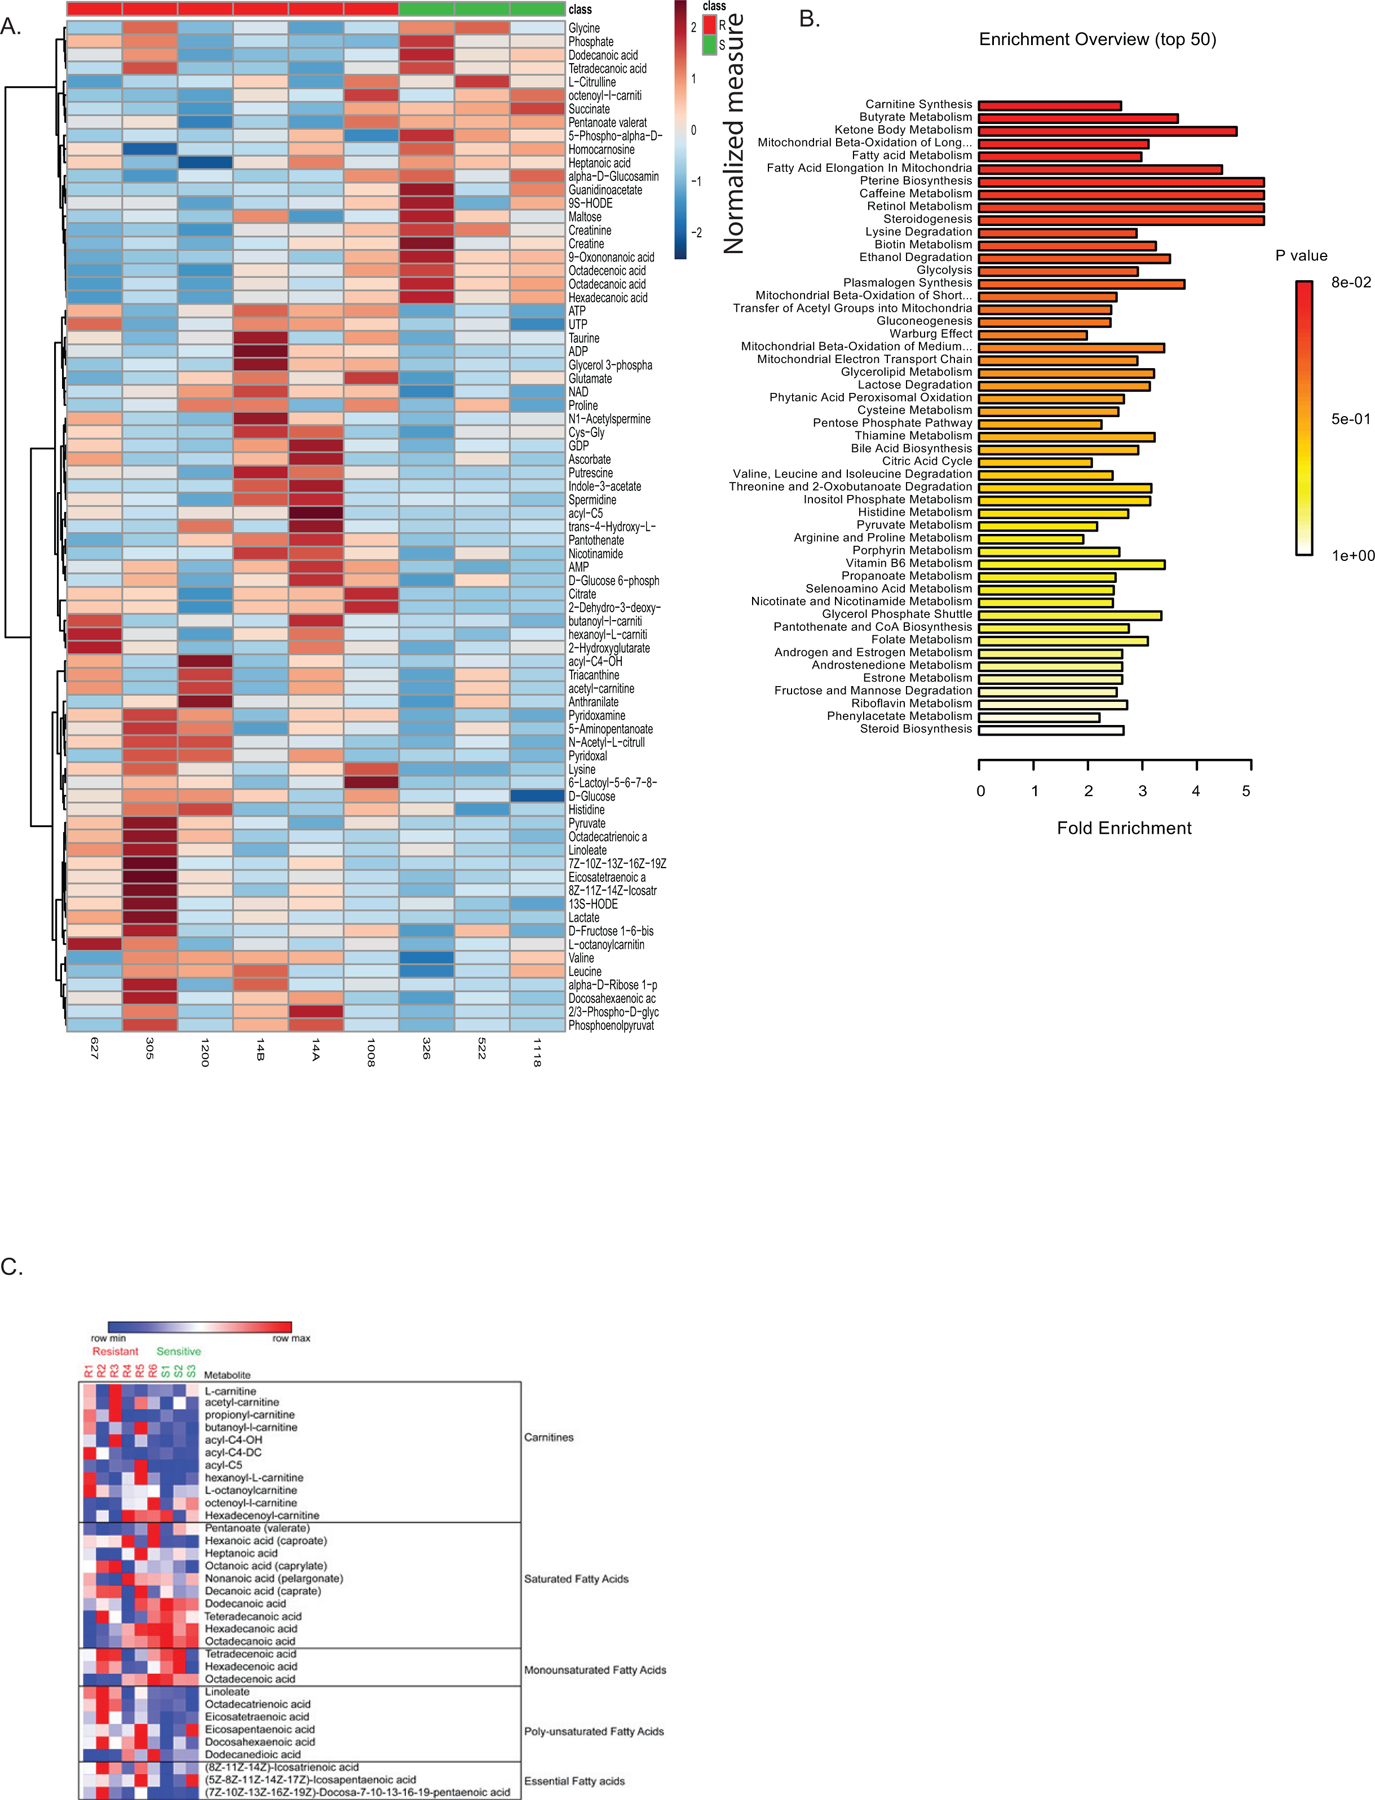
Extended Data Figure 1:

Metabolite analysis of sensitive versus resistant LSCs. A. Global LC/MS metabolite screen of sensitive and resistant LSCs from figure 2. Values are normalized by metabolite to median expression of row. Each data point represents the median calculated from four technical replicates. B. Metabolite pathway analysis shows increased fatty acid metabolism pathways in resistant LSCs as determined by Metaboanalyst software analysis of global metabolite levels in LSCs. P value represents adjusted P value after multiple comparison Holm test. C. Heatmap of carnitine and fatty acid levels as determined by LC/MS. The samples in panels A-C are from the same sensitive (N = 3 patient specimens) and resistant (N=7 patient specimens) AML patient samples.
