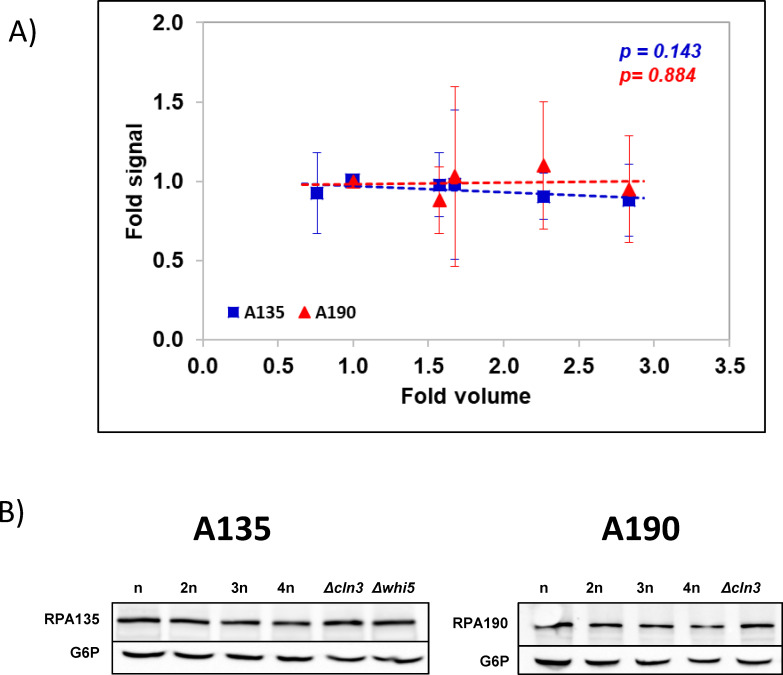
Fig 3. The cellular concentration of RNA pol I does not vary with cell volume.
A) The RNA pol I concentration in the different polyploids (n-4n) and haploid mutants (whi5, cln3) shown in Fig 2A was calculated by Western blot using approximately the same amount of total protein and correcting by the G6P-DH signal. An antibody against the second largest RNA pol I subunit (A135, blue squares) and one against the largest RNA pol I subunit (A190, red triangles) are shown. The graphs (representing the fold change regarding the haploid strain) represent the average and standard deviations of three biological replicates. B) In both cases, an example of a Western blot is shown below. The slopes of the trend lines in panel A) do not significantly deviate from the horizontal according to an F-test (p-values are shown).

