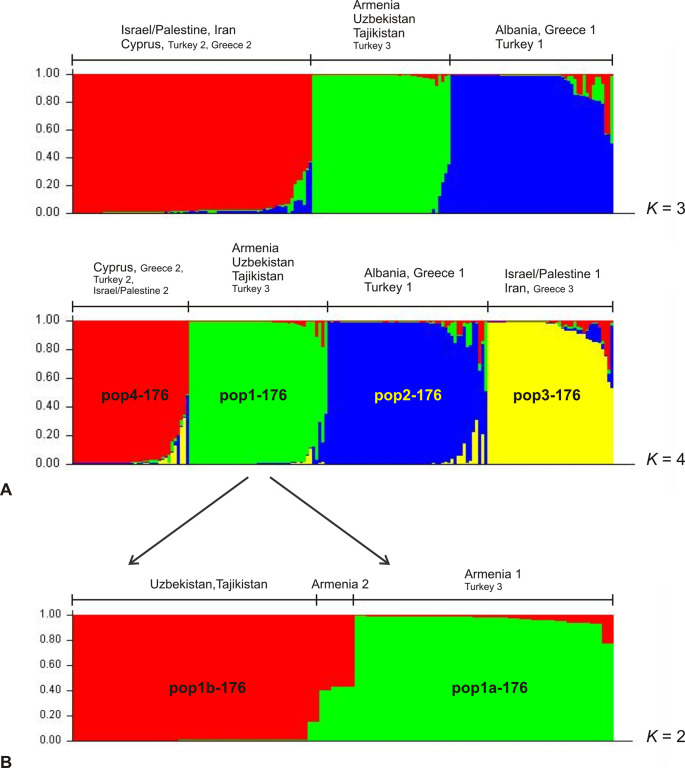
Fig 4. Estimated population structure of a subset of 176 L. infantum MON1 strains most closely related to the Armenian strains as inferred by Bayesian analysis of their MLMT profiles.
In the barplots each strain is represented by a single vertical line divided into K colors, where K is the number of populations assumed. Each color represents one population. The length of the colors segment shows the strain’s estimated proportion of membership (Q) in that population. Strains are sorted by membership coefficient (Q). (A) According to ΔK the most probable number of populations is four (K = 4), in addition also K = 3 is shown. (B) Structure of subpopulation 1 (pop1-176) comprising the strains from Armenia, Uzbekistan, Tajikistan and Turkey3. According to ΔK the most probable number of populations is two (K = 2).

