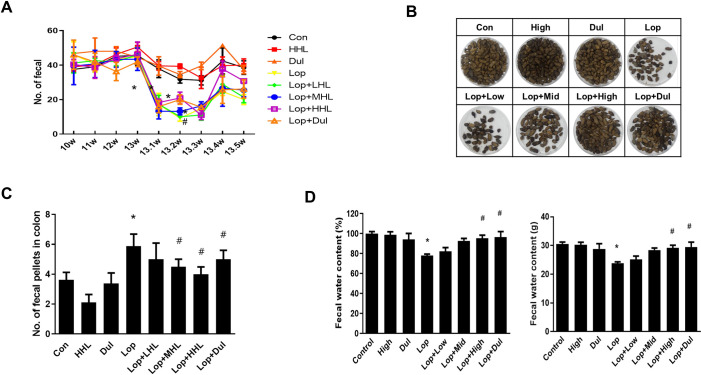
Fig 1. Effect of HLp-nF1 on constipation parameters.
Eight-week-old male rats were treated with loperamide along with 3.2 × 10¹⁰, 8 × 10¹⁰, and 1.6 × 10¹¹ cells/mL HLp-nF1, and Dulcolax individually. A single treatment with 1.6 × 10¹¹ cells/mLHLp-nF1 or Dulcolax was used as the control group. (A) The fecal pellets were counted at the indicated time points. (B) The fecal pellets collected prior to sacrifice, (C) the number of remaining fecal pellets in the colon, and (D) fecal water content is shown. Each value represents the mean ± SD. A t-test was used to determine the means of two groups (n = 11). *P< 0.05 vs. control group, #P< 0.05 vs. loperamide-treated group. Con, control group; Lop, loperamide-treated group; Dul, Dulcolax-treated group (0.75 mg/kg); HHL, treatment with 1.6 × 10¹¹ cells/mL HLp-nF1; Lop+LHL, treatment with loperamide and 3.2 × 10¹⁰ cells/mL HLp-nF1; Lop+MHL, treatment with loperamide and 8 × 10¹⁰ cells/mL HLp-nF1; Lop+HHL, treatment with loperamide and 1.6 × 10¹¹ cells/mL HLp-nF1; Lop+Dul treated group.

