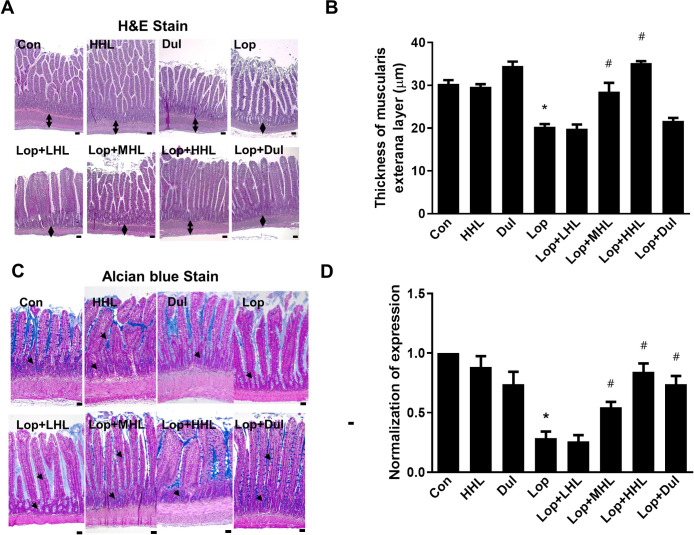
Fig 4. Effects of HLp-nF1 on the histological parameters in rats with loperamide-induced constipation.
Eight-week-old rats were treated with loperamide along with 3.2 × 10¹⁰, 8 × 10¹⁰, and 1.6 × 10¹¹ cells/mL HLp-nF1, and Dulcolax individually. A single treatment with 1.6 × 10¹¹ cells/mL HLp-nF1 or Dulcolax was used as the control. (A) H&E-staining of the ilium and (B) the thickness of the muscularis externa layer was analyzed. (C) Alcian blue staining was performed as described in Materials and Methods, and (D) blue positive-mucin expression was quantified. A t-test was used to determine the means of two groups (n = 3). *P< 0.05 vs. control group, #P< 0.05 vs. loperamide-treated group. Scale bar, 10 μm. Con, control group; Lop, loperamide-treated group; Dul, Dulcolax-treated group (0.75 mg/kg); HHL, treatment with 1.6 × 10¹¹ cells/mL HLp-nF1; Lop+LHL, treatment with loperamide and 3.2 × 10¹⁰ cells/mL HLp-nF1; Lop+MHL, treatment with loperamide and 8 × 10¹⁰ cells/mL HLp-nF1; Lop+HHL, treatment with loperamide and 1.6 × 10¹¹ cells/mL HLp-nF1; Lop+Dul treated group.

