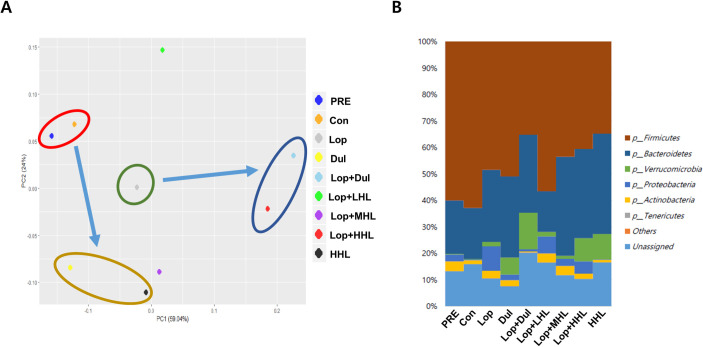
Fig 6. Changes of the genus pattern and microbiome composition in Extracellular Vesicles (EVs) and bacteria in rat feces.
Eight-week-old rats were treated with loperamide along with 3.2 × 10¹⁰, 8 × 10¹⁰, and 1.6 × 10¹¹ cells/mL HLp-nF1, and Dulcolax, individually. A single treatment with 1.6 × 10¹¹ cells/mL HLp-nF1 or Dulcolax was used as the control. (A) The genus pattern in each group is graphically shown. The average relative density of the dominant bacterial phyla. (B) The X-axis shows the groups, and the Y-axis displays the average percentage of sequence reads. The cutoff point for selecting the dominant phyla was set at ≥ 1%. “Others” indicates minor phyla, and “Unassigned” indicates non-identified phyla. PRE, pre-preparation group; Con, control group; Lop, loperamide-treated group; Dul, Dulcolax-treated group (0.75 mg/kg); HHL, treatment with 1.6 × 10¹¹ cells/mL HLp-nF1; Lop+LHL, treatment with loperamide and 3.2 × 10¹⁰ cells/mL HLp-nF1; Lop+MHL, treatment with loperamide and 8 × 10¹⁰ cells/mL HLp-nF1; Lop+HHL, treatment with loperamide and 1.6 × 10¹¹ cells/mL HLp-nF1; Lop+Dul treated group.

