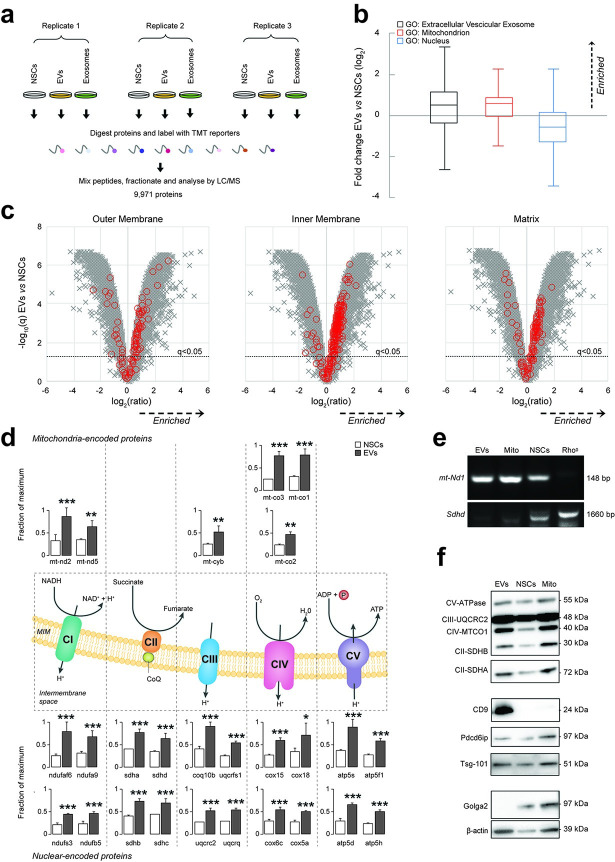
Fig 1. NSCs shed mitochondrial proteins and mtDNA via EVs.
(a) Overview of multiplex TMT-based proteomic experiment. TMT-based proteomics identified a total of 9,971 proteins, of which 9,951 were quantitated across all conditions. (b) Relative abundance of proteins annotated with indicated GOCC subcellular localisations in EVs compared with NSC whole-cell lysates (NSCs). Annotations were available for 9,049/9,971 cellular proteins identified in the multiplex TMT-based functional proteomic experiment illustrated in a. Boxplots show median, interquartile range, and Tukey whiskers for proteins with the following annotations: extracellular vesicular exosome (GO:0070062, black outline, enriched in EVs); mitochondrion (GO:0005739, red outline, enriched in EVs); and nucleus (GO:0005634, blue outline, depleted in EVs). Data are from N = 3 independent biological replicates. (Data available on ProteomeXchange, identifier PXD024368, and in S3 Data). (c) Relative abundance of proteins from different mitochondrial compartments (outer membrane, matrix, and inner membrane) in EVs compared with NSCs. Volcano plots show statistical significance (y axis) vs. fold change (x axis) for 9,951/9,971 cellular proteins quantitated across all 3 biological replicates (no missing values) in the multiplex TMT-based functional proteomic experiment illustrated in a. Proteins annotated with the following GOCC subcellular localisations are highlighted in red: mitochondrial outer membrane (GO:0005741, enriched in EVs); mitochondrial inner membrane (GO: 0005743, enriched in EVs); and mitochondrial matrix (GO:0005759, enriched in EVs). An FDR threshold of 5% is indicated (proteins with Benjamini–Hochberg FDR-adjusted p-values (q values) < 0.05). (Data available on ProteomeXchange, identifier PXD024368, and in S3 Data). (d) Relative abundance of selected mitochondrial proteins in EVs compared with NSCs. Mitochondrial complex (C) proteins enriched in EVs and encoded in the mitochondrial (upper panel) or nuclear (lower panel) genomes in the multiplex TMT-based functional proteomic experiment include: NADH:ubiquinone oxidoreductase or CI [mtnd2 (ND2 subunit), mtnd5 (ND5 subunit), ndufaf6 (assembly factor 6), ndufa9 (subunit A9), ndufs3 (core subunit S3), ndufb5 (1 beta subcomplex subunit 5)], succinate dehydrogenase or CII [Sdha (Subunit A), sdhd (cytochrome b small subunit), sdhb (iron-sulfur subunit), sdhc (cytochrome b560 subunit)], cytochrome b-c1 or CIII [mt-cyb (cytochrome B), Uqcrfs1 (subunit 5), Uqcrc2 (subunit 2), coq10b (coenzyme Q10B), uqcrq (subunit 8)], cytochrome C oxidase or CIV [mt-co3 (oxidase III), mtco1 (oxidase I), mtco2 (oxidase II), cox15 (subunit 15), cox18 (assembly protein 18), cox6c (subunit 6C), cox5a (subunit 5a)] and ATP synthase or CV [atp5f1 (subunit gamma), atp5s (subunit S), atp5d (subunit delta), atp5h (subunit D)]. Mean abundances (fraction of maximum) and 95% CIs from N = 3 independent biological replicates are shown. *q < 0.05, **q < 0.01, ***q < 0.001 vs. NSCs. (Data available on ProteomeXchange, identifier PXD024368, and in S3 Data). (e) Representative PCR amplification of DNA extracted from NSCs, EVs, and isolated mitochondria (Mito). The mitochondrial encoded gene mt-ND1 (NADH-ubiquinone oxidoreductase chain 1) was found to be present in EVs, Mito, and NSCs (L929 Rho0 were used as negative controls). (f) Representative protein expression analysis by WB of NSCs, EVs, and isolated mitochondria (Mito). Mitochondrial complex proteins (CV-ATPase, CII-SDHA, CII-SDHB, CIV-MTCO1, and CIII-UQCRC2), EV positive markers (Tsg-101, Pdcd6ip, and CD9), and negative EV marker (Golga2) are shown, as well as β-actin. CI, II, II, IV, V, complex I, II, II, IV, V; EV, extracellular vesicle; FDR, false discovery rate; GOCC, Gene Ontology Cellular Component; NSC, neural stem cell; PCR, polymerase chain reaction; TMT, Tandem Mass Tag; WB, western blot.

