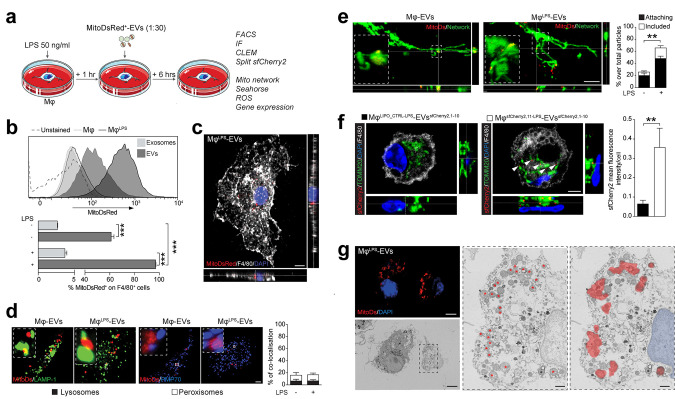
Fig 6. EV-associated mitochondria integrate in the host mitochondrial network.
(a) Experimental setup for the functional in vitro studies of EVs on Mφ. MφLPS were treated with EVs spontaneously released from MitoDsRed+ NSCs (ratio 1:30). Uptake of MitoDSred+ particles and functional analyses of Mφ were assessed at 6 hours posttreatment. (b) Flow cytometry–based representative density plots of Mφ and MφLPS at 6 hours after treatment with MitoDsRed+ EVs or exosomes. Data are mean % (± SEM). ***p ≤ 0.001. N = 3 independent biological replicates. (Data available in S3 Data). (c) A representative confocal image (orthogonal section (XY) of Z-stacks is shown) of MφLPS treated with EVs at 6 hours, showing uptake of MitoDSred+ mitochondria. Nucleus is stained with DAPI (blue). Scale bar: 3 μm. (d) Representative spinning disk micrographs (maximum intensity projection of Z-stacks) and quantification of MitoDsRed+ EVs (red) co-localising with the lysosomal marker LAMP1 (green) or the peroxisomal marker PMP70 (blue) in Mφ. Data are mean values (± SEM). *p < 0.05. N ≥ 10 cells per condition (2 independent experiments). Scale bars: 2 μm. (Data available in S3 Data). (e) Representative spinning disk images (orthogonal section (XY) of Z-stacks is shown) and relative quantification showing MitoDSred+ EVs (red) attached or included in the mitochondrial network of Mφ (previously stained with MitoTracker Green FM). Inset: magnified 3D surface reconstruction of included mitochondria (Imaris Software). Data are percentage of either attaching or including particles over total MitoDSred+ particles in Mφ (± SEM). **p < 0.01. N ≥ 5 cells per condition from N = 3 independent experiments. Scale bars: 5 μm. (Data available in S3 Data). (f) Representative images (orthogonal section (XY) of Z-stacks) of a split FPs showing EVssfCherry2,1–10 fusing with MφsfCherry2,11 (in red) juxtaposed to the host TOMM20+ mitochondrial network (in green) at 6 hours from EV treatment. Nuclei are stained with DAPI (blue). Data are mean values (± SEM). **p < 0.01. N = 10 cells per condition. Scale bars: 5 μm. (Data available in S3 Data). (g) Representative CLEM image of MφLPS treated with MitoDsRed+-EVs for 6 hours. Top left panel, confocal image (orthogonal section (XY) of 1 Z-stack) showing MitoDsRed+ EVs (red) and MφLPS nuclei (blue); bottom left panel, scanning EM image of the MφLPS depicted in the confocal image. Scale bars: 5 μm. Middle panel, magnified ROI of the MφLPS mitochondrial network ultrastructure; right panel, superposition of confocal and scanning EM images showing co-localisation of the MitoDsRed+ mitochondria (red) with the host MφLPS mitochondrial network. Nucleus is pseudocolored in blue. Asterisks show MitoDsRed+ mitochondria. Scale bars: 1 μm. CLEM, correlative-light electron microscopy; DAPI, 4′,6-diamidino-2-phenylindole; EV, extracellular vesicle; LPS, lipopolysaccharide; ROI, region of interest.

