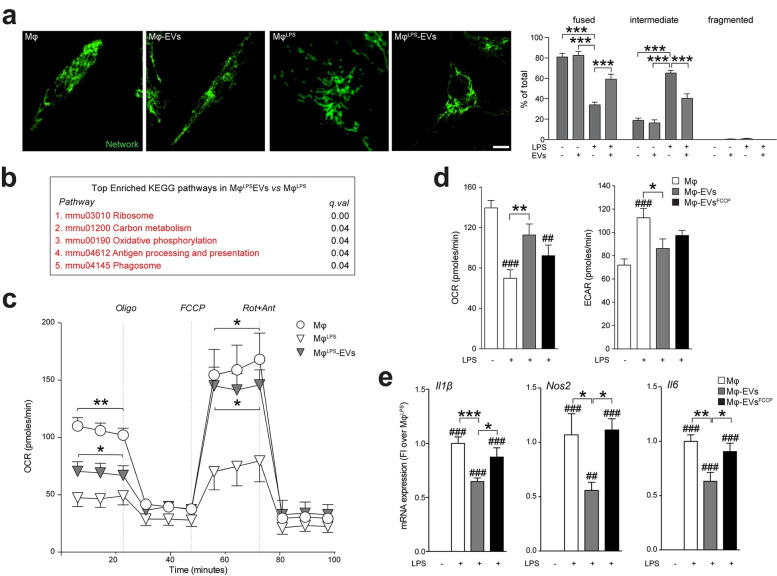
Fig 8. The transfer of EV-associated mitochondria inhibits the metabolic switch of pro-inflammatory mononuclear phagocytes.
(a) Representative spinning disk images and quantification showing Mφ mitochondrial network labelled with TOMM20 (green) polymorphic dynamics after LPS stimulation and/or EV treatment (1:30). Data are expressed as mean % (± SEM). ***p < 0.001. N = 6 biological replicates. Scale bars: 4 μm. (Data available in S3 Data). (b) Top enriched KEGG pathways in genes up-regulated in EV-treated vs. untreated MφLPS at 6 hours. Expression data obtained by microarray analysis. (Data available on ArrayExpress, identifier E-MTAB-8250). (c) XF assay of the OCR during a mitochondrial stress protocol of MφLPS at 6 hours from EV treatment (1:30). Unstimulated Mφ were used as controls. Data are mean values (± SEM). *p < 0.05, **p < 0.01 vs. MφLPS. N = 2 independent experiments. (Data available in S3 Data). (d) XF assay of the basal OCR and ECAR of MφLPS at 6 hours from treatment with EVs or treatment with EVs preexposed to the uncoupling agent FCCP vs. MφLPS. Unstimulated Mφ were used as controls. Data are mean values (± SEM). ##p < 0.01, ###p < 0.001 vs. unstimulated Mφ. *p < 0.05, **p < 0.01. N ≥ 4 technical replicates from N ≥ 2 independent experiments. (Data available in S3 Data). (e) Expression levels (qRT-PCR) of pro-inflammatory genes (Il1β, Nos2, and Il6) in MφLPS at 6 hours from treatment with EVs or treatment with EVs preexposed to the uncoupling agent FCCP. Data are mean FI over unstimulated Mφ (± SEM). ##p < 0.01, ###p < 0.001 vs. unstimulated Mφ. *p < 0.05, **p < 0.01, ***p < 0.001. N ≥ 3 biological replicates from N ≥ 2 independent experiments. (Data available in S3 Data). ECAR, extracellular acidification rate; EV, extracellular vesicle; FI, fold induction; KEGG, Kyoto Encyclopedia of Genes and Genomes; LPS, lipopolysaccharide; OCR, oxygen consumption rate; qRT-PCR, quantitative real-time polymerase chain reaction; XF, extracellular flux.

