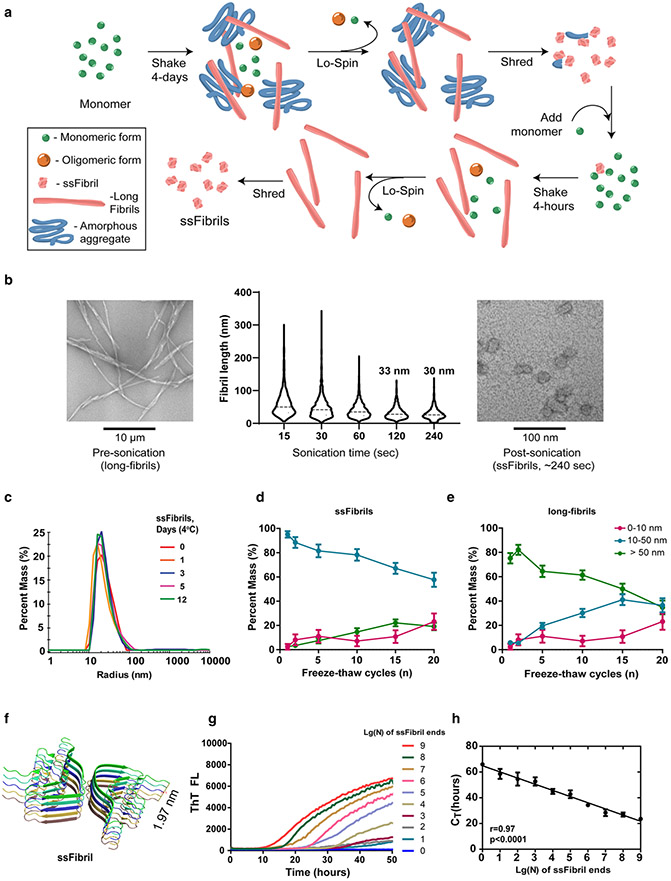
Fig. 1.
Single-molecule quantification of temperature and time-stable ssFibrils with quantitative RT-QuIC (qRT-QuIC). a Schematic for the purification of short-stumpy α-synuclein fibrils (ssFibrils). A long initial shaking round in saline (pH 7.4) results in an admixture of long α-synuclein rod fibrils, amorphous aggregates, oligomers, and unpolymerized monomer. Heavy insoluble fibrils and aggregates are separated from unpolymerized proteins and small oligomers through brief low-speed centrifugation. Pelleted heavy particles are then subjected to strong-sonication (otherwise known as shredding). The shredded aggregates are diluted (0.1% w/v) into a secondary rapid fibril elongation reaction. Isolation, washing, and sonication of these heavy fibril products results in the generation of enriched short-stumpy fibrils, or ssFibrils. b Representative transmission electron microscopy images and analysis of (n > 1000 particles measured over three experiments) human α-synuclein full-length fibrils, and processed ssFibrils. c Dynamic light-scattering size distributions of ssFibrils after extended incubations in saline buffer at 4 °C. d Light-scattering measures of ssFibrils after extensive repetitive freeze thaw cycles. e Light-scattering measures of long α-synuclein rod fibrils subjected to the same repetitive freeze thaw cycling. f Rendered stack representations of α-synuclein monomers (n = 10 monomers shown) from rod fibrils formed from spontaneous α-synuclein fibrillization, as described [30]. g Representative real-time quaking-induced conversion shown as decadic logarithmic performance over known quantities of ssFibrils. Calculated fibril-forming units (FFUs) are indicated, with the assumption of two-fibril-forming ends/particle. Lg(0) indicates reactions with no ssFibrils added, indicating spontaneous fibrillization. h Optimal log-linear regression analysis based on calculated CT values from triplicate reactions (see Supplemental Fig. 2). Error bars represent SEM, dots indicate mean group values from at least three independent experiments, and each Lg(N) curve shown represents the calculated average of at least three independent experiments

