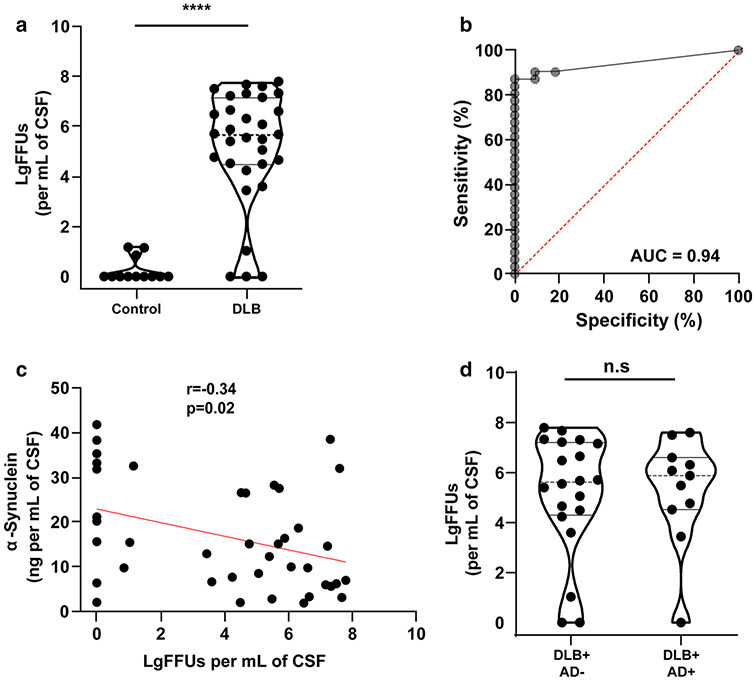
Fig. 4.
qRT-QuIC analysis of CSF from DLB. a Quantification of fibril-forming units (FFUs) per mL in brain-matched CSF from subjects with a pathological diagnosis of neocortical DLB (Table 1) and normal controls, with spike-in standards of ssFibrils into CSF that was previously identified as negative for fibril activity. b ROC group discrimination for assessing qRT-QuIC accuracy in resolving a pathological diagnosis of DLB from controls. Percent sensitivity and specificity are 87 and 100. c Correlation analysis of total α-synuclein concentration and LgFFUs per mL in CSF. Spearman coefficients and corresponding p values are indicated. d Violin plots representing distributions of LgFFUs (calculated per mL of CSF) to AD neuropathology. Spearman coefficients and corresponding p values are indicated. Comparison analysis for panel a and d uses a two-tailed unpaired t test, where n.s. is not significant and ****p < 0.0001. Each data point represents the mean value calculated from at least three independent experiments

