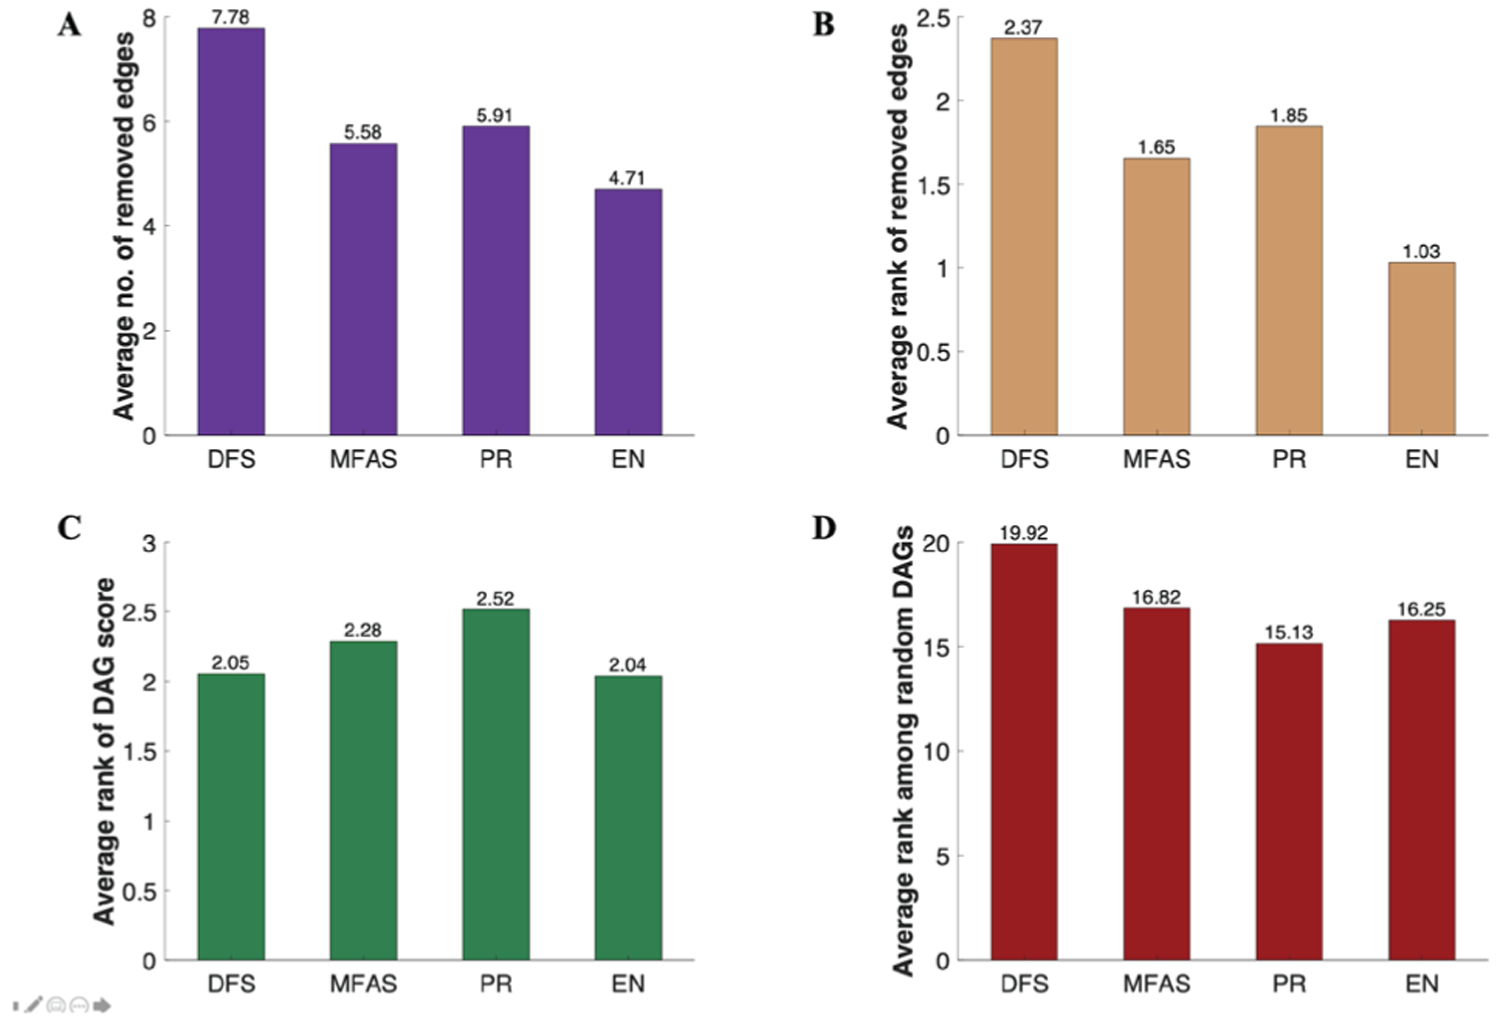
Figure 2. Directed acyclic graph (DAG) statistics.

Based on the four cycle removal methods, depth-first search (DFS), minimum feedback arc set (MFAS), PageRank (PR), and ensemble (EN), applied on 130 gene interaction networks deduced from pathways using KEGG2Net, A average number of edges removed; B average rank of the method (per network) based on the number of edges removed (ascending); C average rank of the method’s DAG score (per network) among the four methods (descending); D average rank of the method’s DAG score (per network) among the 1,000 random DAGs that has the same numbers of edges and nodes as the DAG (descending). For parts C and D, Bayesian Information Criterion (BIC) scoring is used to assess the fitness of the DAGs to the synthetic data generated based on the gene interaction network (obtained by KEGG2Net).
