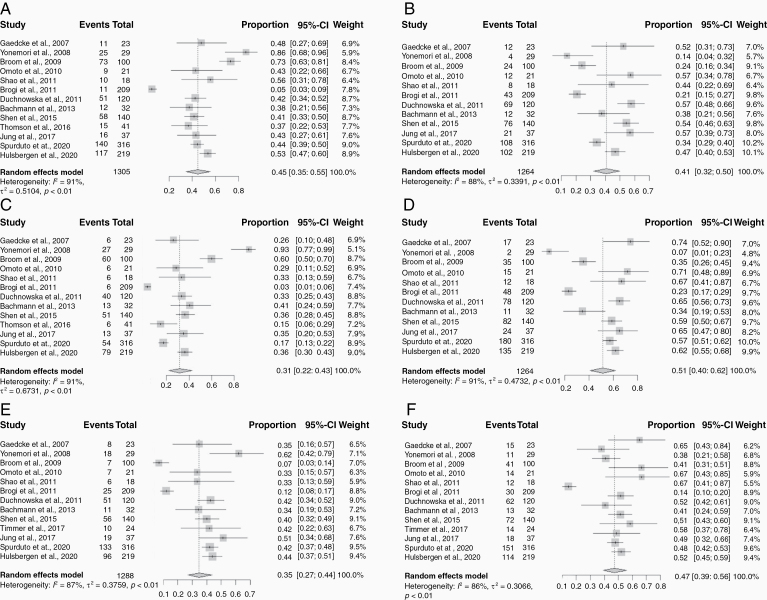
Figure 1.
Forest plots of primary tumor receptor expression profiles for each receptor expression subtype: (A) ER+; (B) ER−; (C) PR+; (D) PR−; (E) HER2+; (F) HER2−. Squares indicate the proportions from individual studies and horizontal lines indicate the 95% confidence interval. The size of the data marker corresponds to the relative weight assigned in the pooled analysis using the random effects model. Diamond indicates the pooled proportion with 95% confidence interval.

