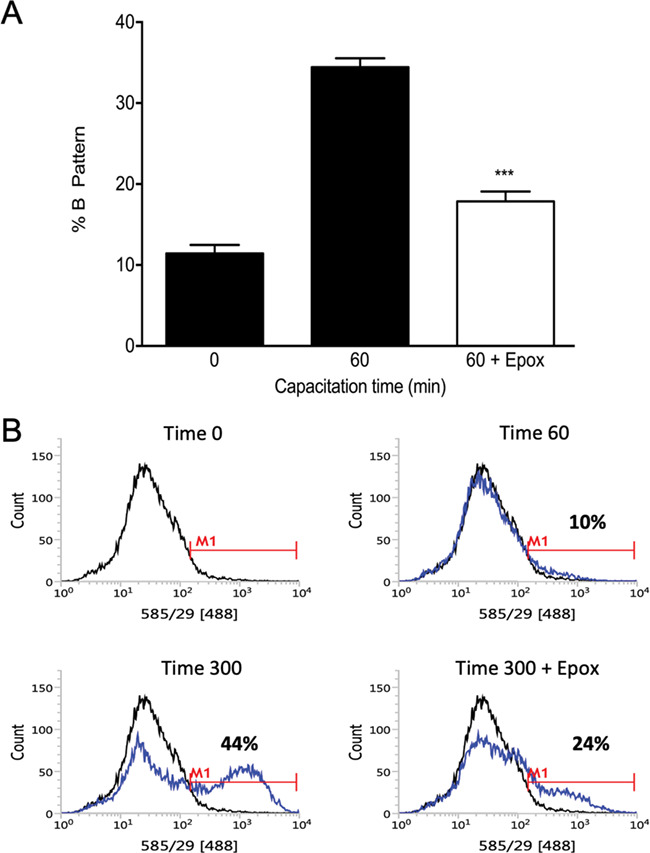
Figure 2.

Effect of proteasome inhibition on human sperm capacitation. (A) Evaluation of sperm capacitation by the CTC assay. Spermatozoa were incubated for 0 (0) or 60 (60) min with 0.1% v/v DMSO or for 60 min with 10 μM epoxomicin (60 + Epox). Data are expressed as mean ± SEM, N = 7. ***P < 0.001 compared to 60 min without inhibitor. (B) Evaluation of sperm capacitation by tyrosine phosphorylation, assayed by flow cytometry. A representative histogram out of six replicates with consistent results is shown. Black lines represent the fluorescence distribution pattern of non-capacitated sperm suspensions (Time 0) and the blues lines represent the fluorescence distribution pattern of spermatozoa capacitated for 60 min (Time 60), 300 min (Time 300) and 300 min in the presence of 10 μM epoxomicin (Time 300 + Epox).
