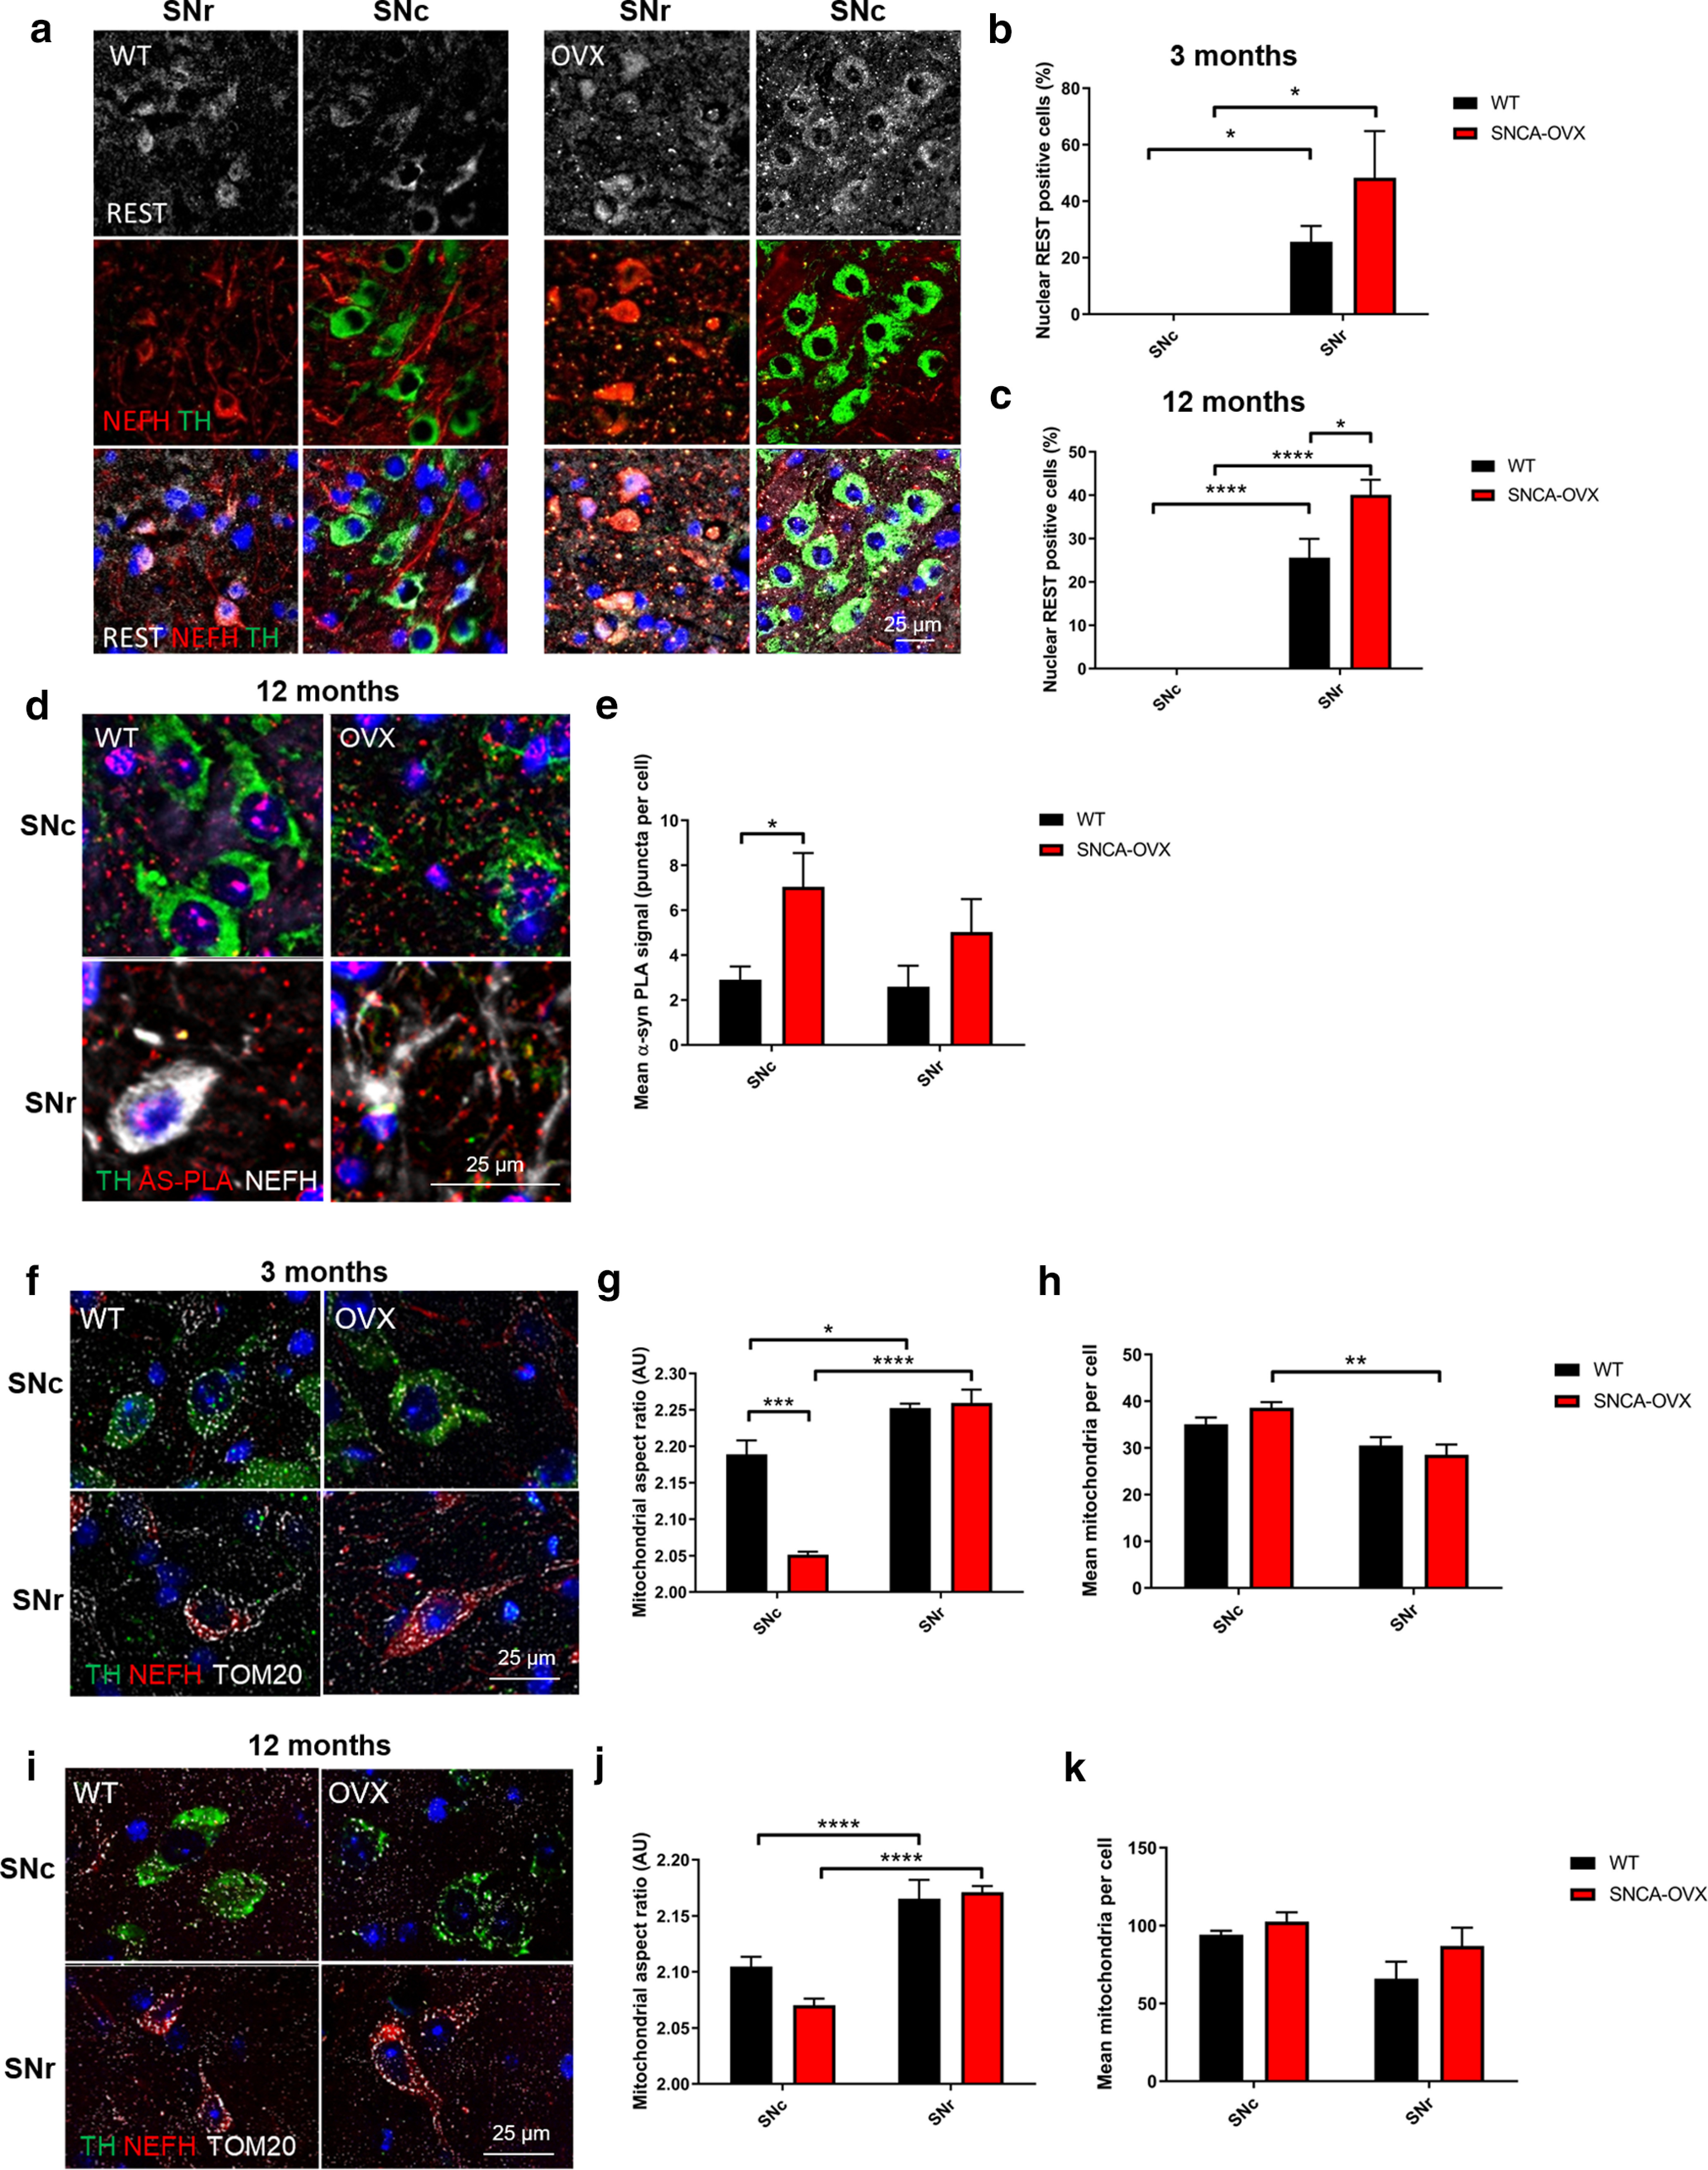
Figure 4.

Absence of nuclear REST correlates with increased vulnerability of neurons to α-synuclein aggregation and mitochondrial dysfunction. a–c, Nuclear REST is absent from dopaminergic, but not GABAergic, cells. Quantification of nuclear REST (gray), staining in NEFH (red) and TH (green) cells in WT, and SNCA-OVX mouse midbrain at (b) 3 months and (c) 12 months. d, e, α-Synuclein oligomers are increased in dopaminergic neurons of SNCA-OVX mice. α-Synuclein PLA staining (red) in TH (green) and NEFH (gray) cells in WT and SNCA-OVX mouse midbrain. f–k, Mitochondria fragmentation in dopaminergic neurons is exacerbated by α-synuclein. Representative images of TOM20 (gray) staining in TH (green) and NEFH (red) in (f–h) 3-month-old and (i–k) 12-month-old WT and SNCA-OVX midbrain. g, j, Mitochondrial AR. h, k, Average mitochondrial count per cell. For AS-PLA puncta and mitochondrial analysis, 25 cells per neuronal cell type and animal were analyzed. *p < 0.05; **p < 0.01; ***p < 0.001; ****p < 0.0001; two-way ANOVA Sidak. For extended mitochondrial morphology analysis over time, see Extended Data Figure 4-1. (b) Two-way ANOVA, Sidak (F(1,14) = 21.78) p = 0.0004; (c) two-way ANOVA, Sidak (F(1,12) = 139.1) p < 0.0001; (e) two-way ANOVA, Sidak (F(1,10) = 8.974) p = 0.0134; (g) two-way ANOVA, Sidak (F(1,8) = 98.5) p < 0.0001, (F(1,8) = 22.85) p = 0.014; (h) two-way ANOVA, Sidak (F(1,8) = 18.65) p = 0.0026; (j) two-way ANOVA, Sidak (F(1,12) = 62.44) p < 0.0001.
