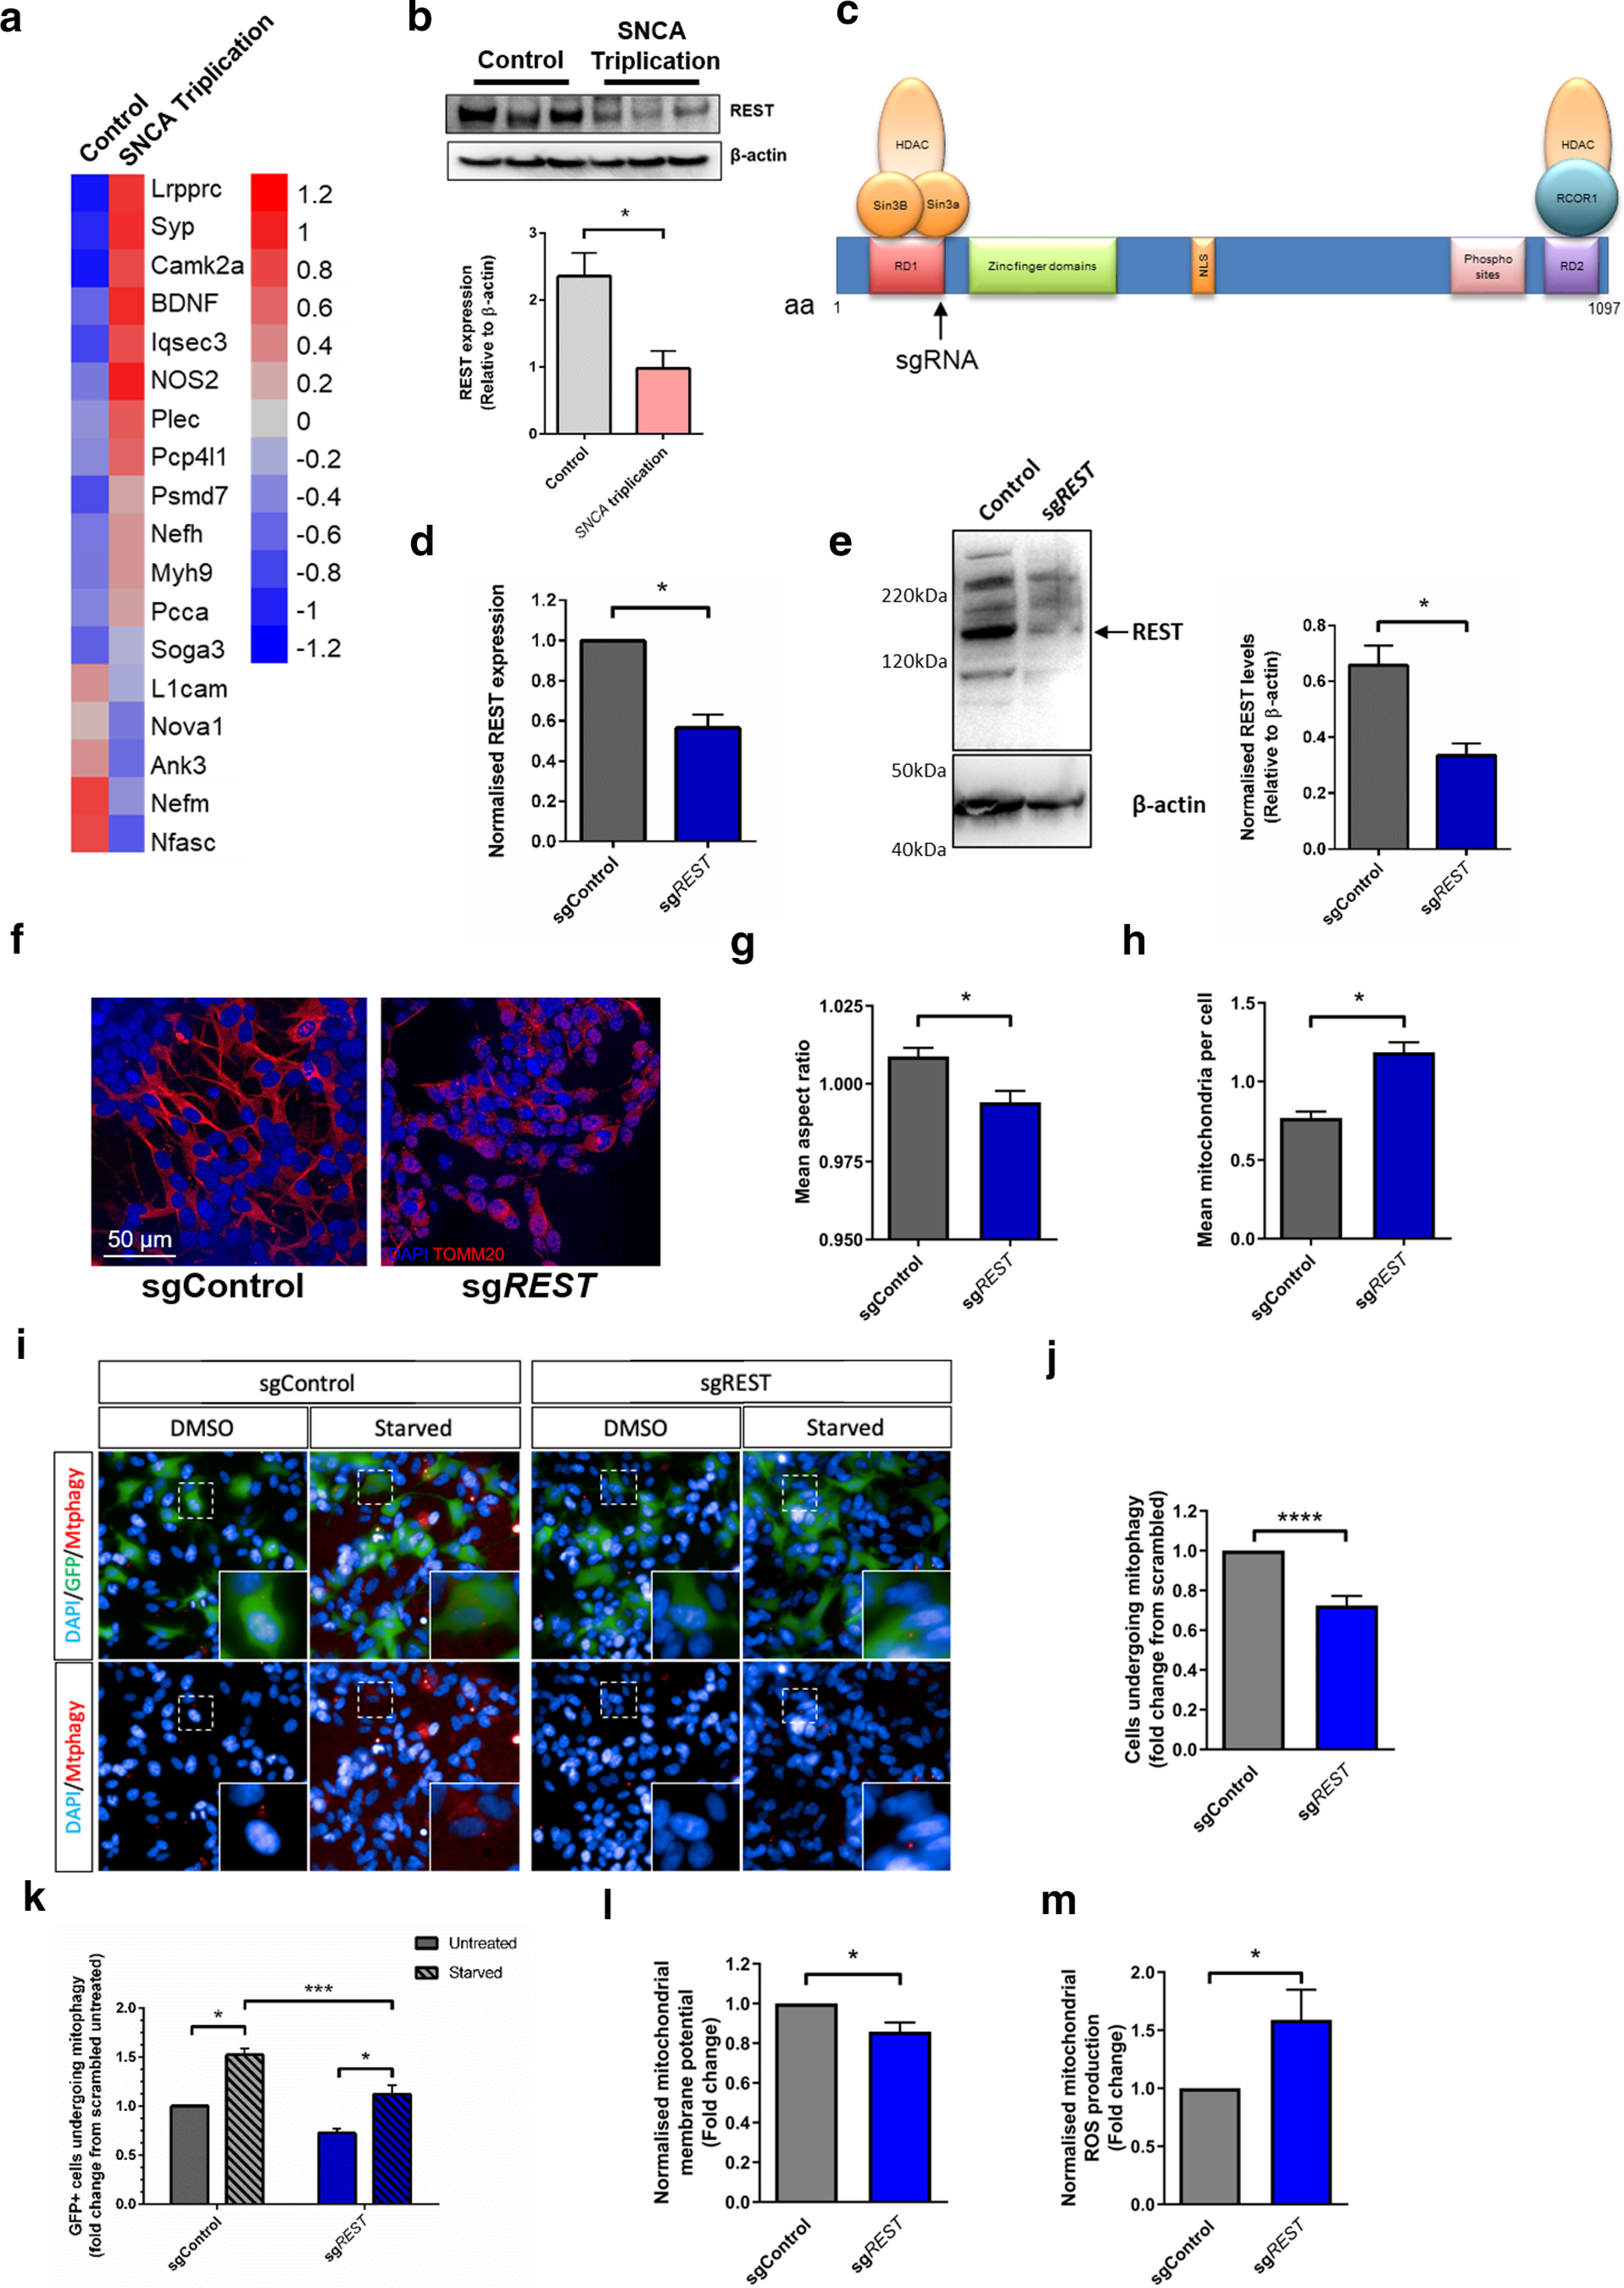
Figure 5.

Inhibition of REST is observed in SNCA-Triplication neurons and causes mitochondrial and mitophagy defects. a, Anticorrelation of REST target gene expression in iPSC-derived dopaminergic neuronal cultures from a SNCA-Triplication patient (GDS4156) (Devine et al., 2011). b, Decreased REST protein expression levels in iPSC-derived dopaminergic neuronal cultures from a SNCA-Triplication patient (n = 3). c, Schematic representation of REST gene showing sgRNA targeting site. Confirmation of (d) REST transcript knockdown relative to HPRT expression and (e) REST protein reduced relative to β-actin after Cas9-mediated KO in a polyclonal cell population (n = 3). f–h, Representative immunofluorescence images of TOM20 (red) showing dysfunctional mitochondrial morphology in starved polyclonal REST KO lines showing (g) mean mitochondrial count per cell and (h) AR (n = 3). i–k, REST KO induced mitophagy deficits. i, Representative images of mitophagy events in SH-SY5Y cells showing mtphagy staining (red puncta) in cells expressing Cas9 (green) j, Quantification of basal mitophagy in cells expressing Cas9 and sgRNA (GFP+) or GFP– cells. k, Quantification of mitophagy in starved GFP+ cells expressing REST-targeting or scrambled guide. l, Decreased mitochondrial membrane potential in polyclonal REST KO cells assessed using JC-10, under basal conditions (n = 4). m, Increased mitochondrial ROS production under basal conditions, in polyclonal REST KO cells (n = 6). For extended analysis and assay validation, see Extended Data Figure 5-1. (b) Mann–Whitney p = 0.05; (d) Mann–Whitney p = 0.05; (e) Mann–Whitney p = 0.0089; (g) Mann–Whitney p = 0.0154; (h) Mann–Whitney p = 0.0026; (j) Mann–Whitney p < 0.0001; (k) two-way ANOVA, Sidak (F(1,20) = 29.76) < 0.0001, (F(1,20) = 54.18) < 0.0001; (l) Mann–Whitney p = 0.0143; (m) Mann–Whitney p = 0.0234. *p < 0.05; ***p < 0.001; ****p < 0.0001.
