
Figure 3.
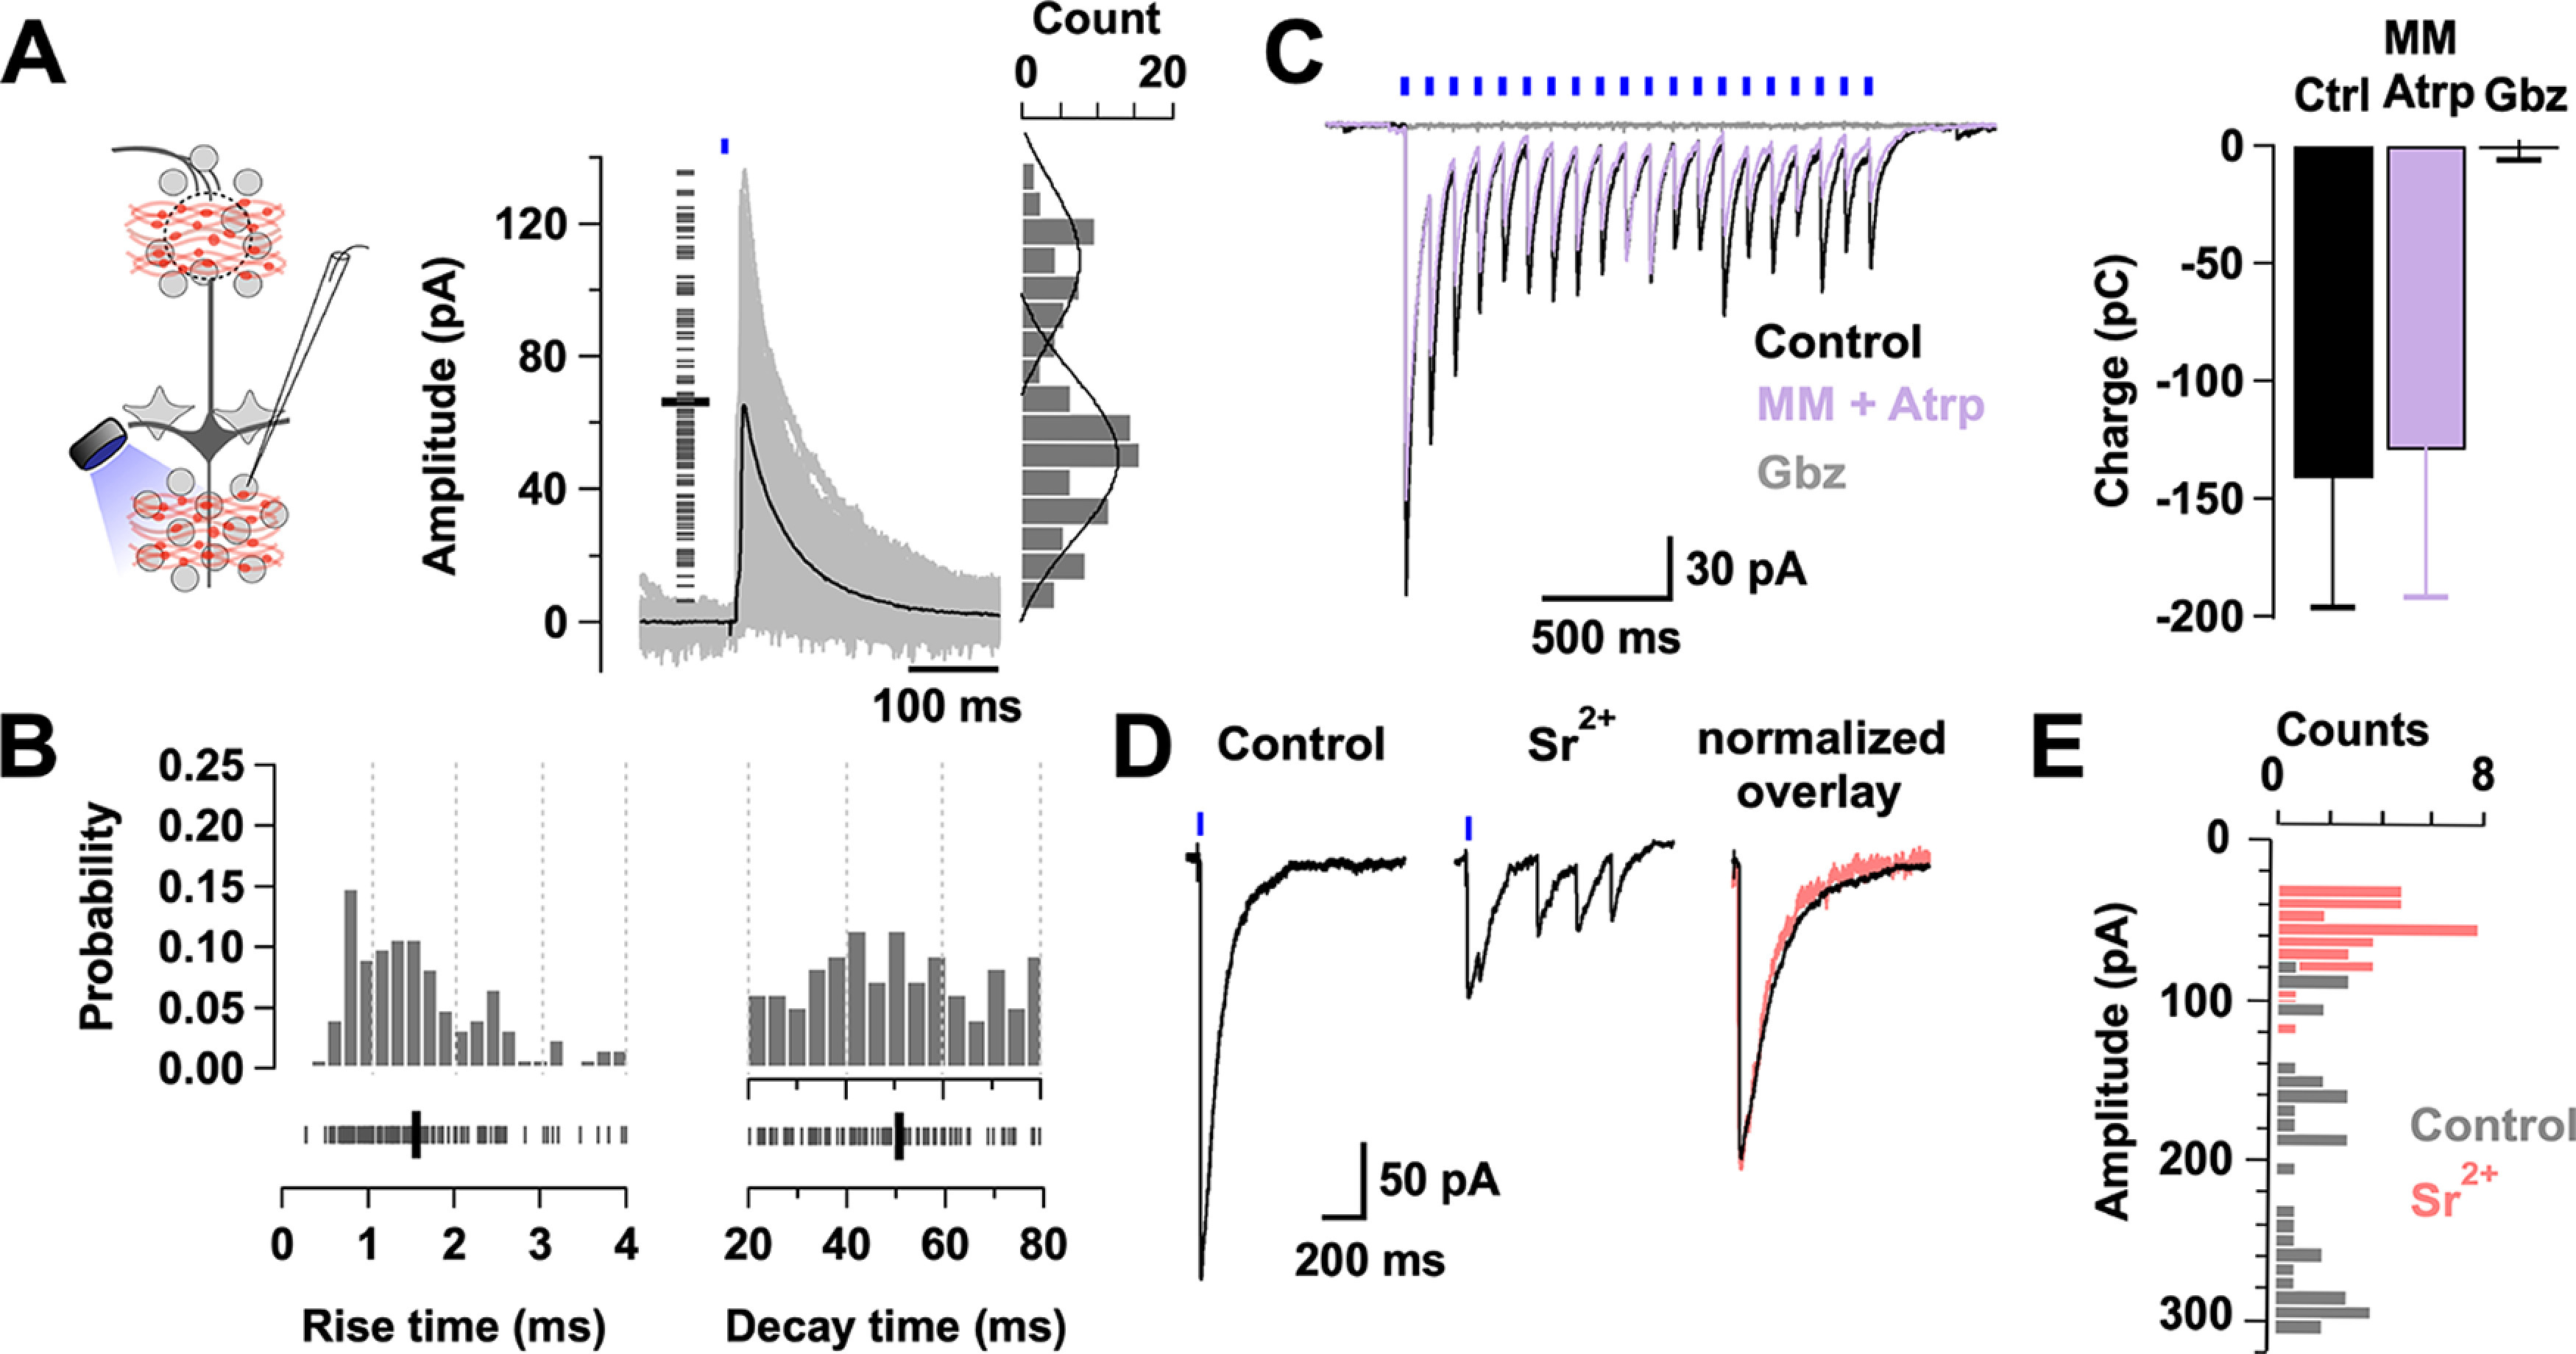
Synaptic properties of the BF long-range GABAergic inputs onto GCs. A, Left, Diagram of the experimental configuration. GCs were recorded in voltage clamp, while GABAergic axons expressing ChR2 were stimulated with a brief pulse of light (0.5-1 ms). Right, Overlay of selected min-eIPSCs (gray traces) in GCs (n = 5 cells, 3 mice). Only min-eIPSCs with rise times of <4 ms are included (n = 120 events, 5 cells). Left, Short gray lines indicate the amplitude of single events. The min-eIPSC had an average amplitude of 66 ± 3 pA (thick black line). Right, The amplitude histogram of the min-eIPSCs. Amplitudes show a bimodal distribution with a small peak centered at 48 pA and a higher peak at 100 pA. Black lines indicate the fitting of two Gaussian distributions to the amplitude distribution. B, Probability distribution histograms for the rise time (left, 10%-90% of the peak) and decay time (right, τw) of the min-eIPSC events shown in A. An equivalent number of events were taken from each cell (median 26). Bottom, Ticks represent the values for each event. Thick black lines indicate average rise time (1.6 ± 0.1 ms) and decay time (50.6 ± 1.8 ms). C, eIPSCs recorded in GCs, using a CsCl-based internal solution, in response to LED stimulation (5 ms, 10 Hz). At this frequency of stimulation, the peak amplitude decreases with time, but each eIPSC appears synchronous throughout the train (black traces). The eIPSCs are unaffected by the perfusion of a mixture of the cholinergic blockers mecamylamine (MM, 10 μm) and atropine (Atrp, 3 μm) (purple trace; n = 5, p = 0.25), but completely blocked by the GABAAR blocker gabazine (Gbz, 10 μm) (gray trace; n = 3, p = 0.04). D, Left, Light-evoked IPSCs in GCs are desynchronized by the equimolar replacement of calcium by strontium (Sr2+, 2 mm). Right, Overlay of peak normalized IPSCs for control (black) and strontium (pink) showing similar kinetics. C, D, The holding potential is −70 mV. E, Histogram overlay of the eIPSC amplitudes during control (gray) and strontium (pink) application (n = 3 cells).