Figure 4.

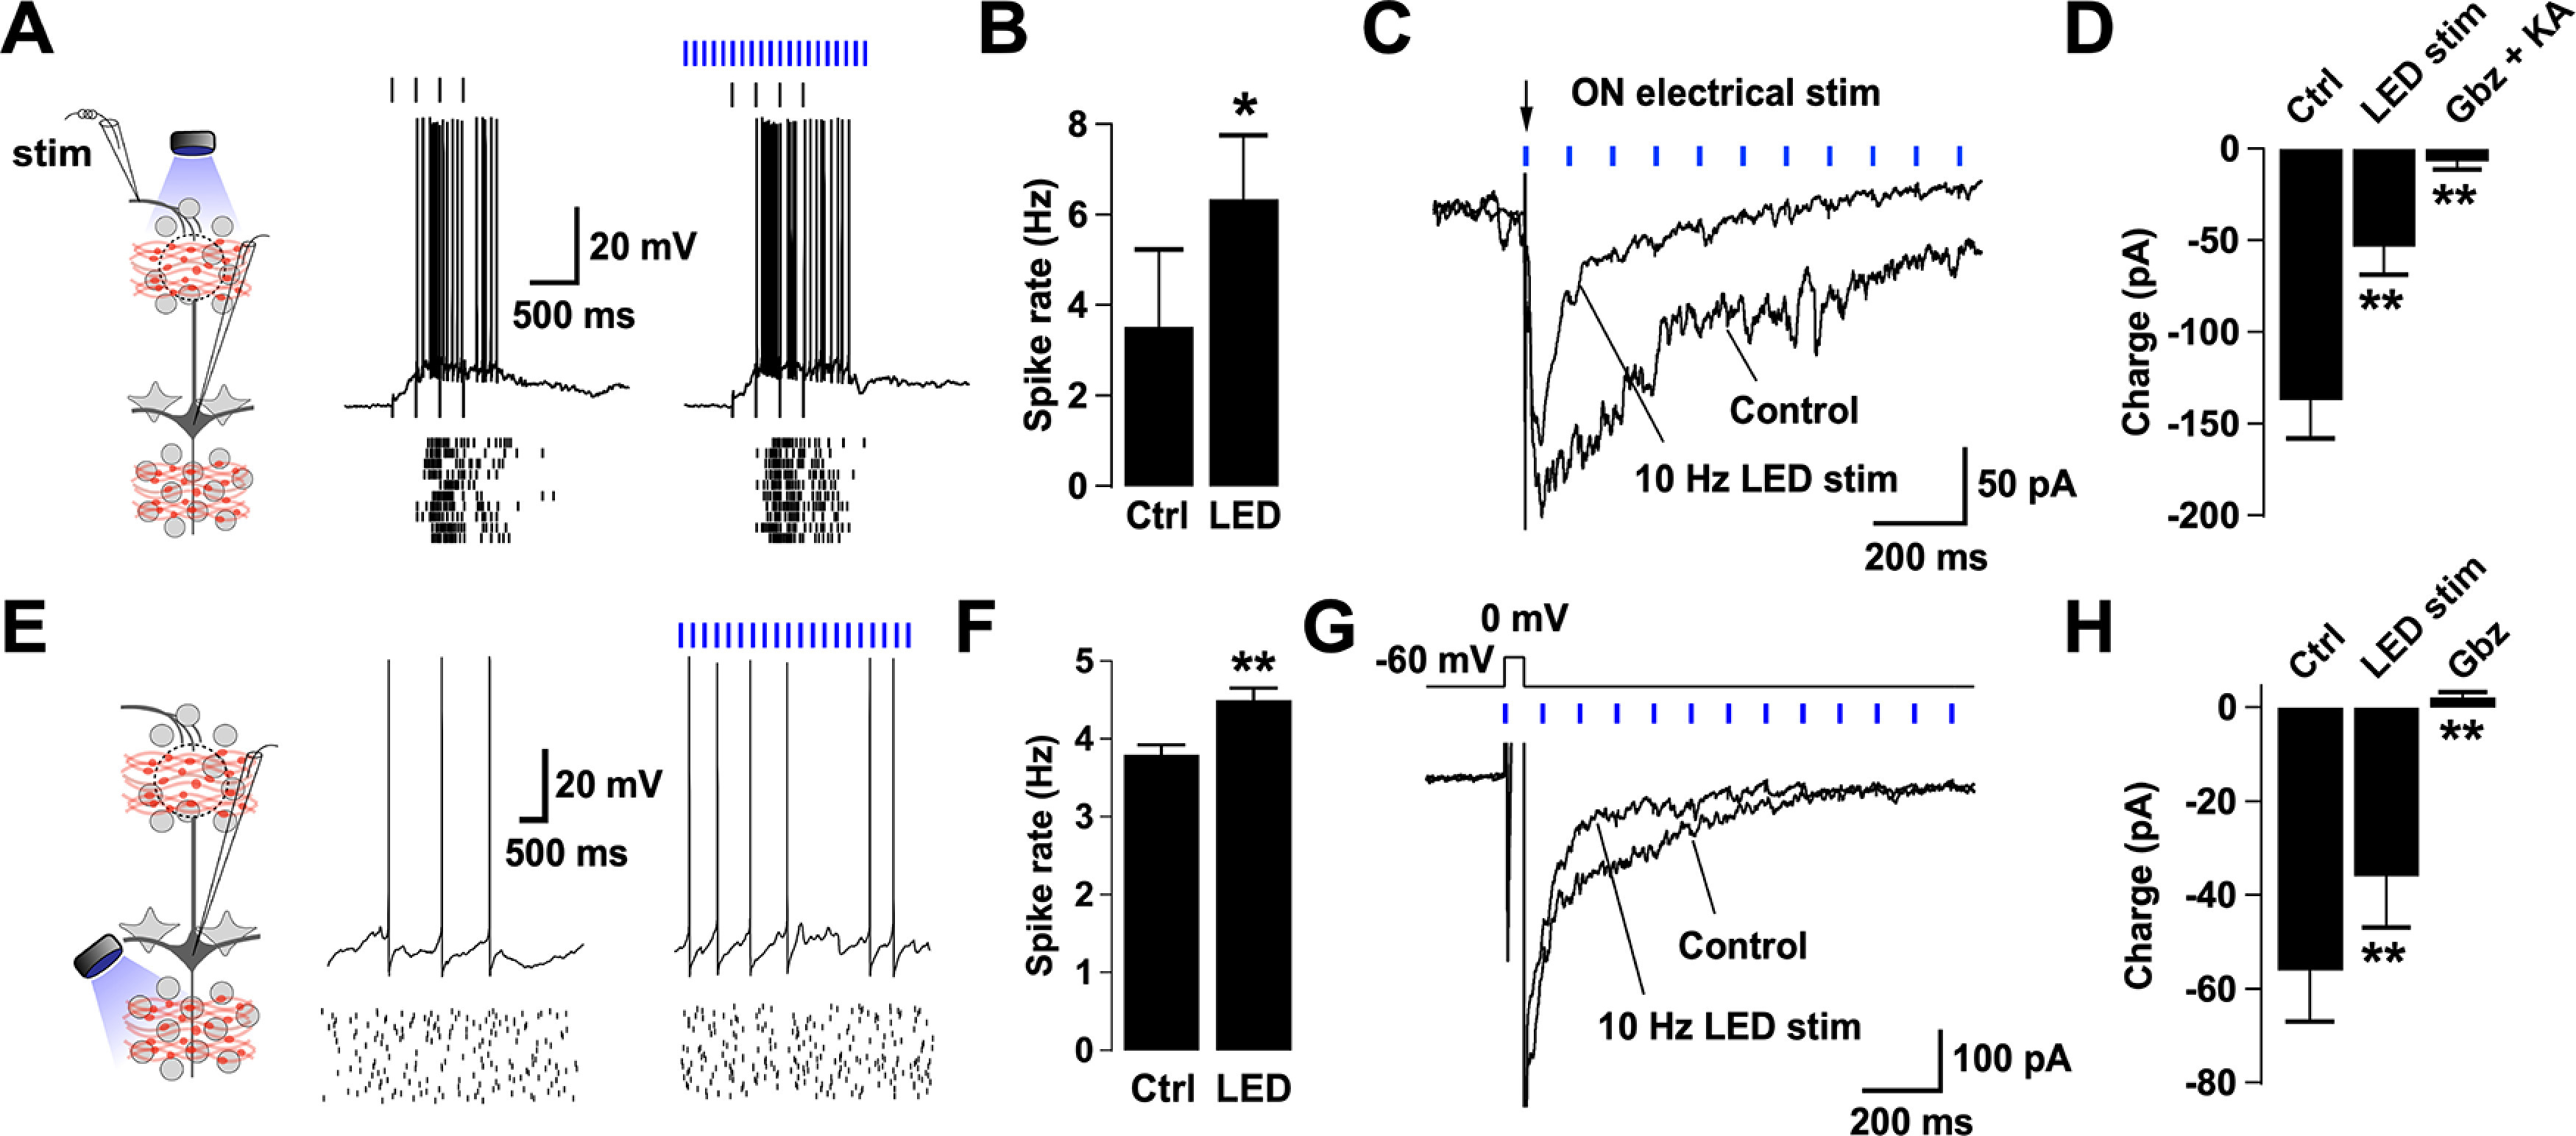
Activation of BF GABAergic inputs disinhibits MCs and reduces DDI. A, Left, Diagram of the experimental configuration. MCs were recorded either in current or voltage clamp while the sensory axons in the ON were activated by electrical stimulation. BF GABAergic axons expressing ChR2 were activated by blue light in the GL. Right, Responses in a representative MC recorded while stimulating the ON with a glass electrode (100 µA, 100 µs, 4 Hz, top black ticks) in the presence (left) or absence (right) of LED stimulation (at 10 Hz, blue ticks). The stimulus intensity was adjusted to elicit firing in the MC. Bottom, Spike raster plots for 10 trials in the cell shown above. The membrane potential was −57 mV (with zero current injection). B, Summary bar graphs for spike frequency showing a significant increase in the firing rate during the LED stimulation compared with control (n = 4, p = 0.01). C, Synaptic currents evoked in an MC by electrical stimulation of the ON (100 µA, 100 µs, arrow). Recordings were performed in symmetrical chloride, in which excitatory and inhibitory currents are seen as inward deflections. A single ON stimulation produced a long-lasting inward current, which was reduced in the presence of LED stimulation in the GL (blue ticks). The holding potential is −60 mV. D, The large barrage of evoked synaptic activity by the ON stimulation is greatly suppressed by LED stimulation (n = 10, p < 0.001), and completely abolished by blockers of GABAA and glutamate receptors (gabazine [Gbz], 10 μm; kynurenic acid [KA], 1 mm, respectively; n = 6, p = 0.01). E, Left, Diagram of the experimental arrangement. MCs were recorded either in current or voltage clamp while LED stimulation was directed to the GCL. Right, Voltage traces of a representative MC held at peri-threshold membrane potential in control and in the presence of LED stimulation (4 Hz). Spike raster plots for 20 trials are shown in the traces below. F, Summary bar graphs for spike frequency showing a significant increase in the firing rate during the LED stimulation compared with control (n = 6, p = 0.004). Light directed to the GL did not significantly change the firing rate of MCs. Results are shown in Extended Data Figure 4-2A, B. G, Overlay of average current traces showing DDI on a MC evoked by a short depolarization (0 mV, 50 ms) in control and in the presence of LED stimulation (10 Hz). The holding potential is −60 mV. H, Summary bar plot showing a significant difference in the synaptic charge transferred in control versus during LED stimulation (n = 8, p = 0.003). Consistently, Gbz (10 μm) completely blocked the evoked dendrodendritic current in MCs (n = 10, p = 0.0002). The reduction of the ON-evoked response and depolarization induced inhibition in MCs by light stimulation of BF-LRGNs axons persisted in the presence of dopamine receptor antagonists. These results are shown in Extended Data Figure 4-1. In addition, light stimulation of the GL significantly reduced DDI in MCs, shown in Extended Data Figure 4-2C, D. *p < 0.05. **p < 0.01.
