
Figure 5.
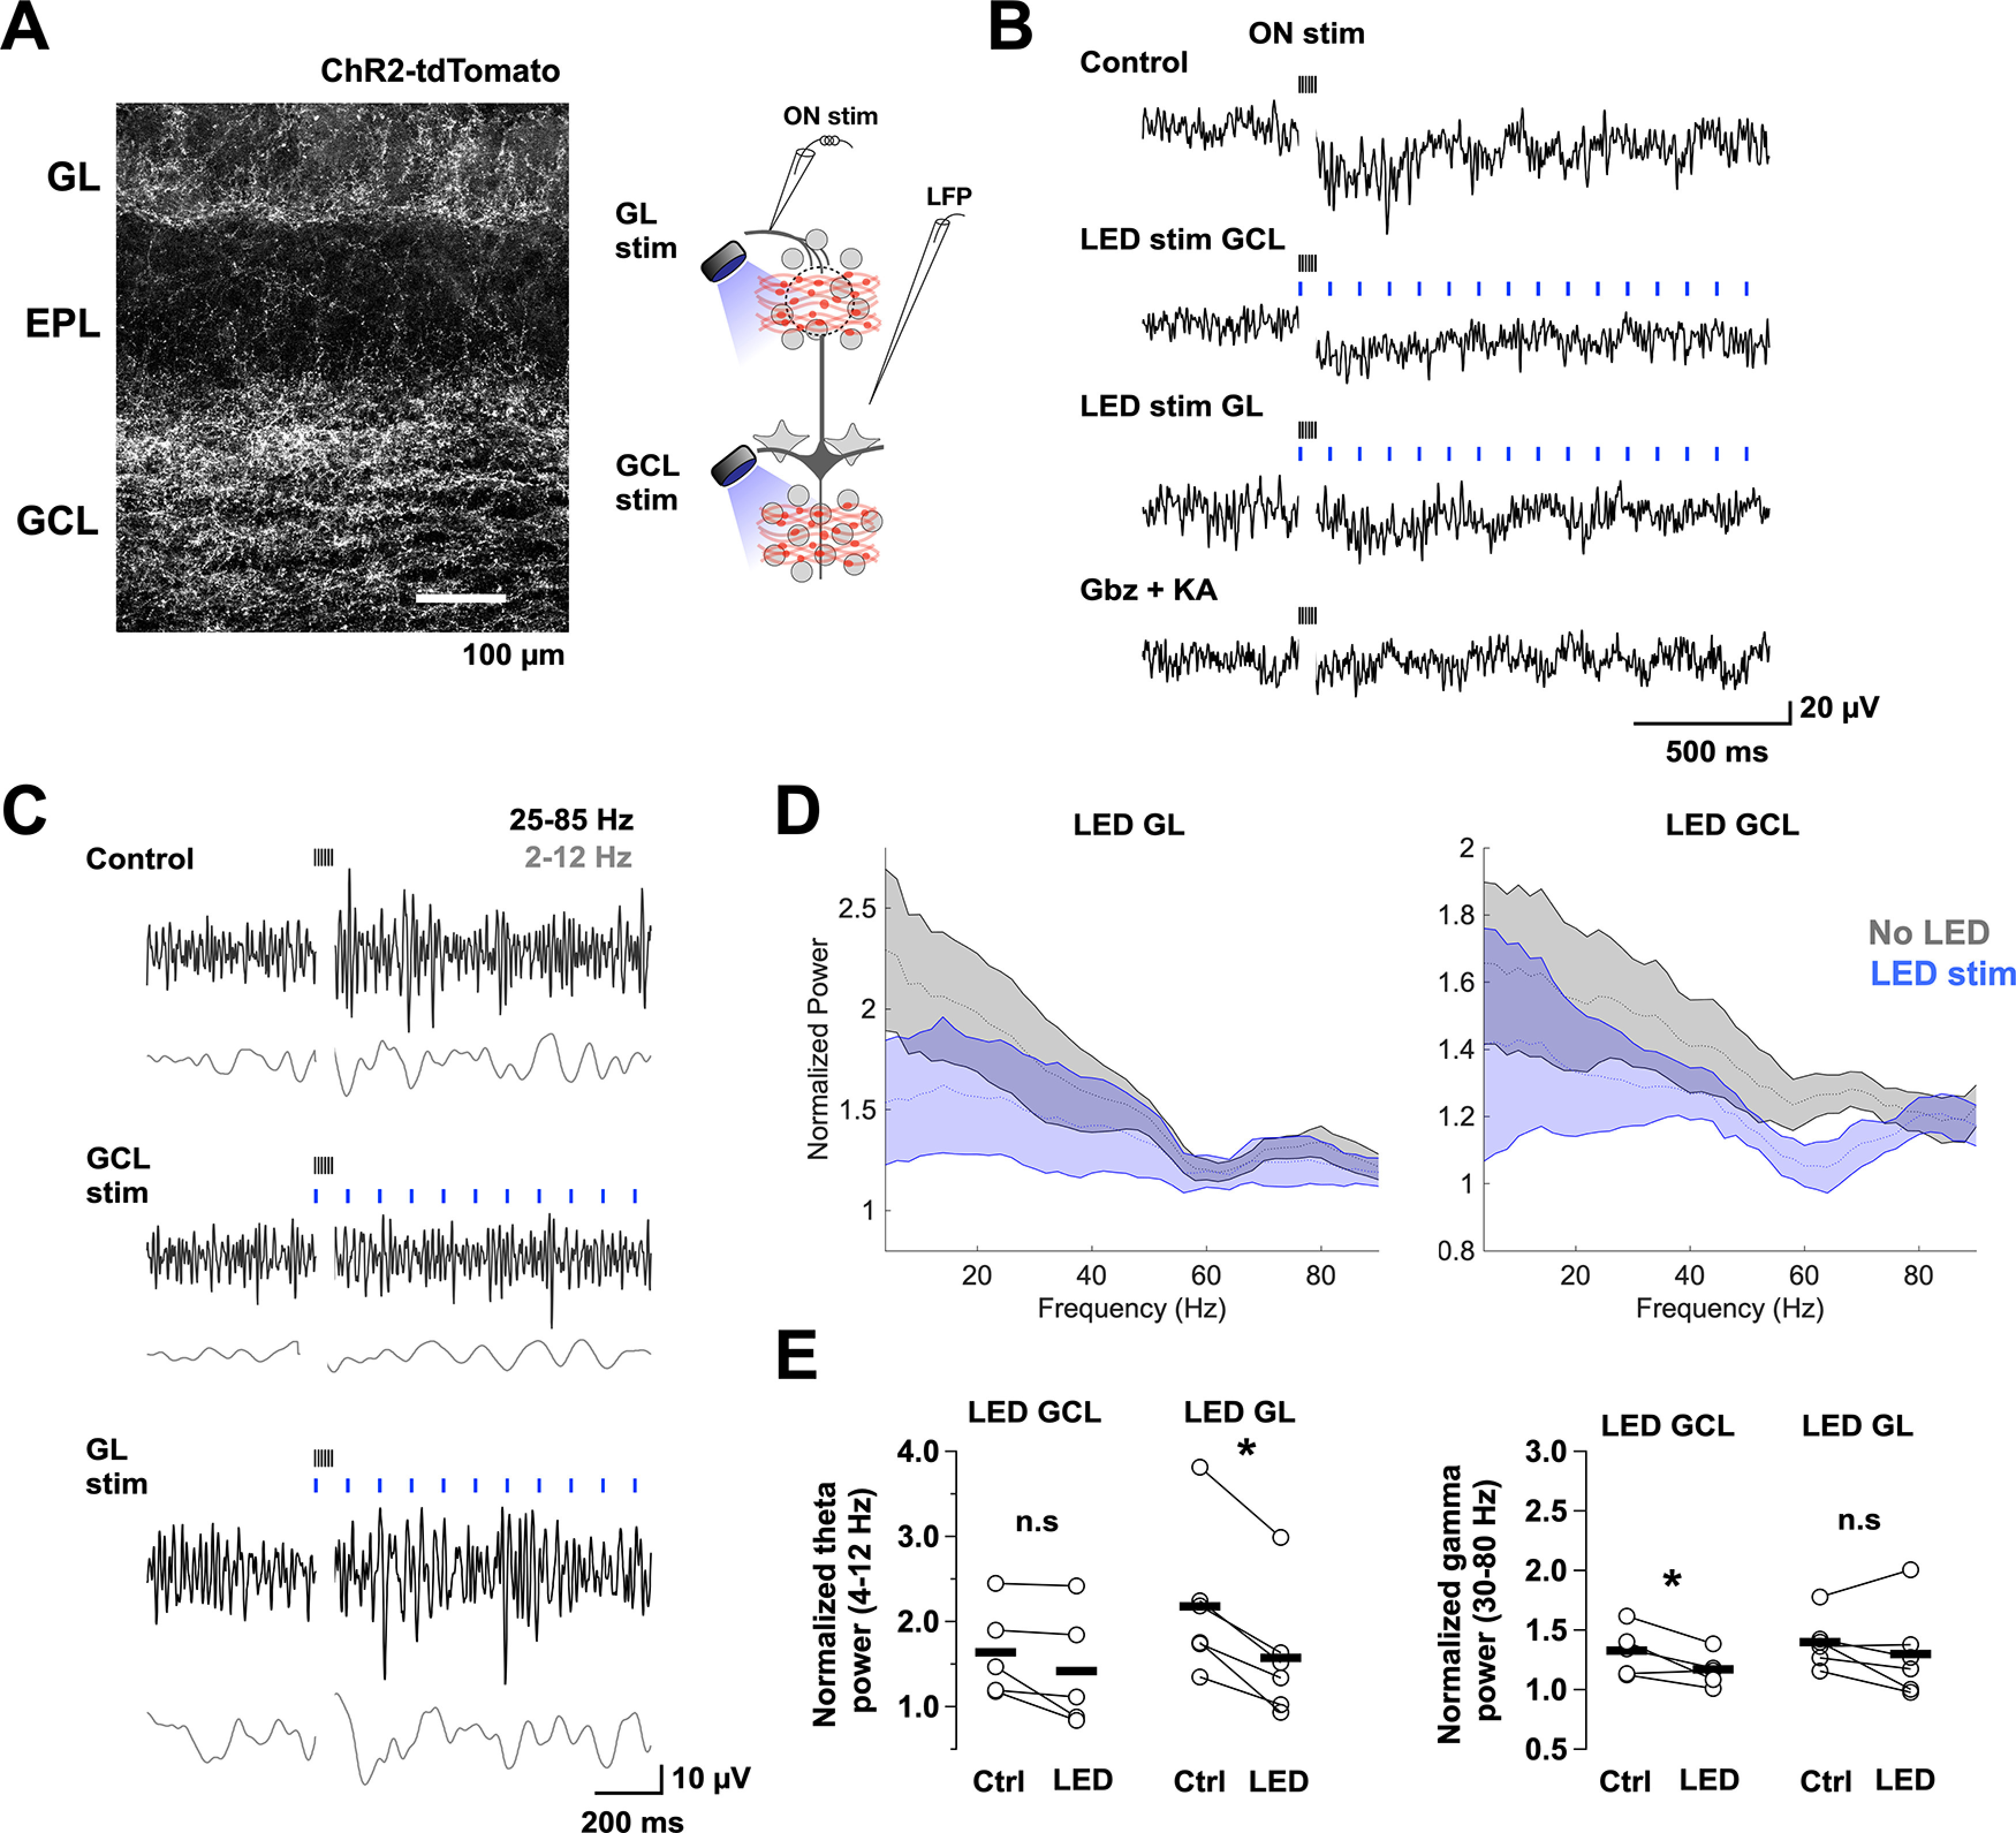
Layer-specific modulation of LFP oscillations by activation of BF GABAergic inputs. A, Left, Image of a recorded section of the OB showing expression of ChR2-tdTomato achieved by an injection of AAV5-Flex-ChR2-tdTomato virus in the MCPO. Right, Diagram of the experimental configuration. A low-resistance patch electrode was placed in the EPL to record the LFP in OB slices containing BF GABAergic axons expressing ChR2. Oscillatory activity was elicited by stimulating the ON with a brief high-frequency stimulus (100 µA, 100 Hz for 50 ms). In alternate trials, we stimulated the BF GABAergic axons with a blue LED (5 ms, 10 Hz for 2 s) directed to the GCL or the GL using a 40× objective focused ∼400 μm apart. B, Raw traces of LFP recordings in the EPL during electrical stimulation of the ON (black ticks) in control (top), with LED stimulation over the GCL (blue ticks, middle) or the GL (bottom), and in the presence of the synaptic blockers kynurenic acid (KA, 1 mm) and gabazine, 10 μm). C, Band pass filtered LFP traces for the different conditions; low frequency, 2-12 Hz (θ, gray), and high frequency, 25-85 Hz (γ, black). D, Mean normalized 300 Hz low pass power spectra for a 1 s window of LFP recording during GL (left) and GCL (right) LED stimulation. Power was normalized with respect to the pre-ON stimulation period. The power spectra show significant activity <20 Hz, as well as a shoulder at higher frequency. E, Pair comparison of the normalized power of the θ (top plots) and γ frequency bands (bottom plots) in the absence (control) and presence of light stimulation (LED). Light stimulation in the GL significantly reduced the power of the θ band (n = 6, p = 0.001), but not the γ band (n = 6, p = 0.31), whereas LED stimulation in the GCL significantly reduced the power of the γ band (n = 5, p = 0.05), but not the θ band (n = 5, p = 0.11). Representative raw power spectrograms before and after ON stimulation, as well as normalized power spectrograms in the presence of synaptic blockers are shown in Extended Data Figure 5-1. *p < 0.05.