
Figure 1. Interrogation of Granuloma Inflammatory State by scRNA-seq Reveals Type 2 Activation and an Inverse Correlation Between Type 1 Responses and Macrophage Epithelialization.
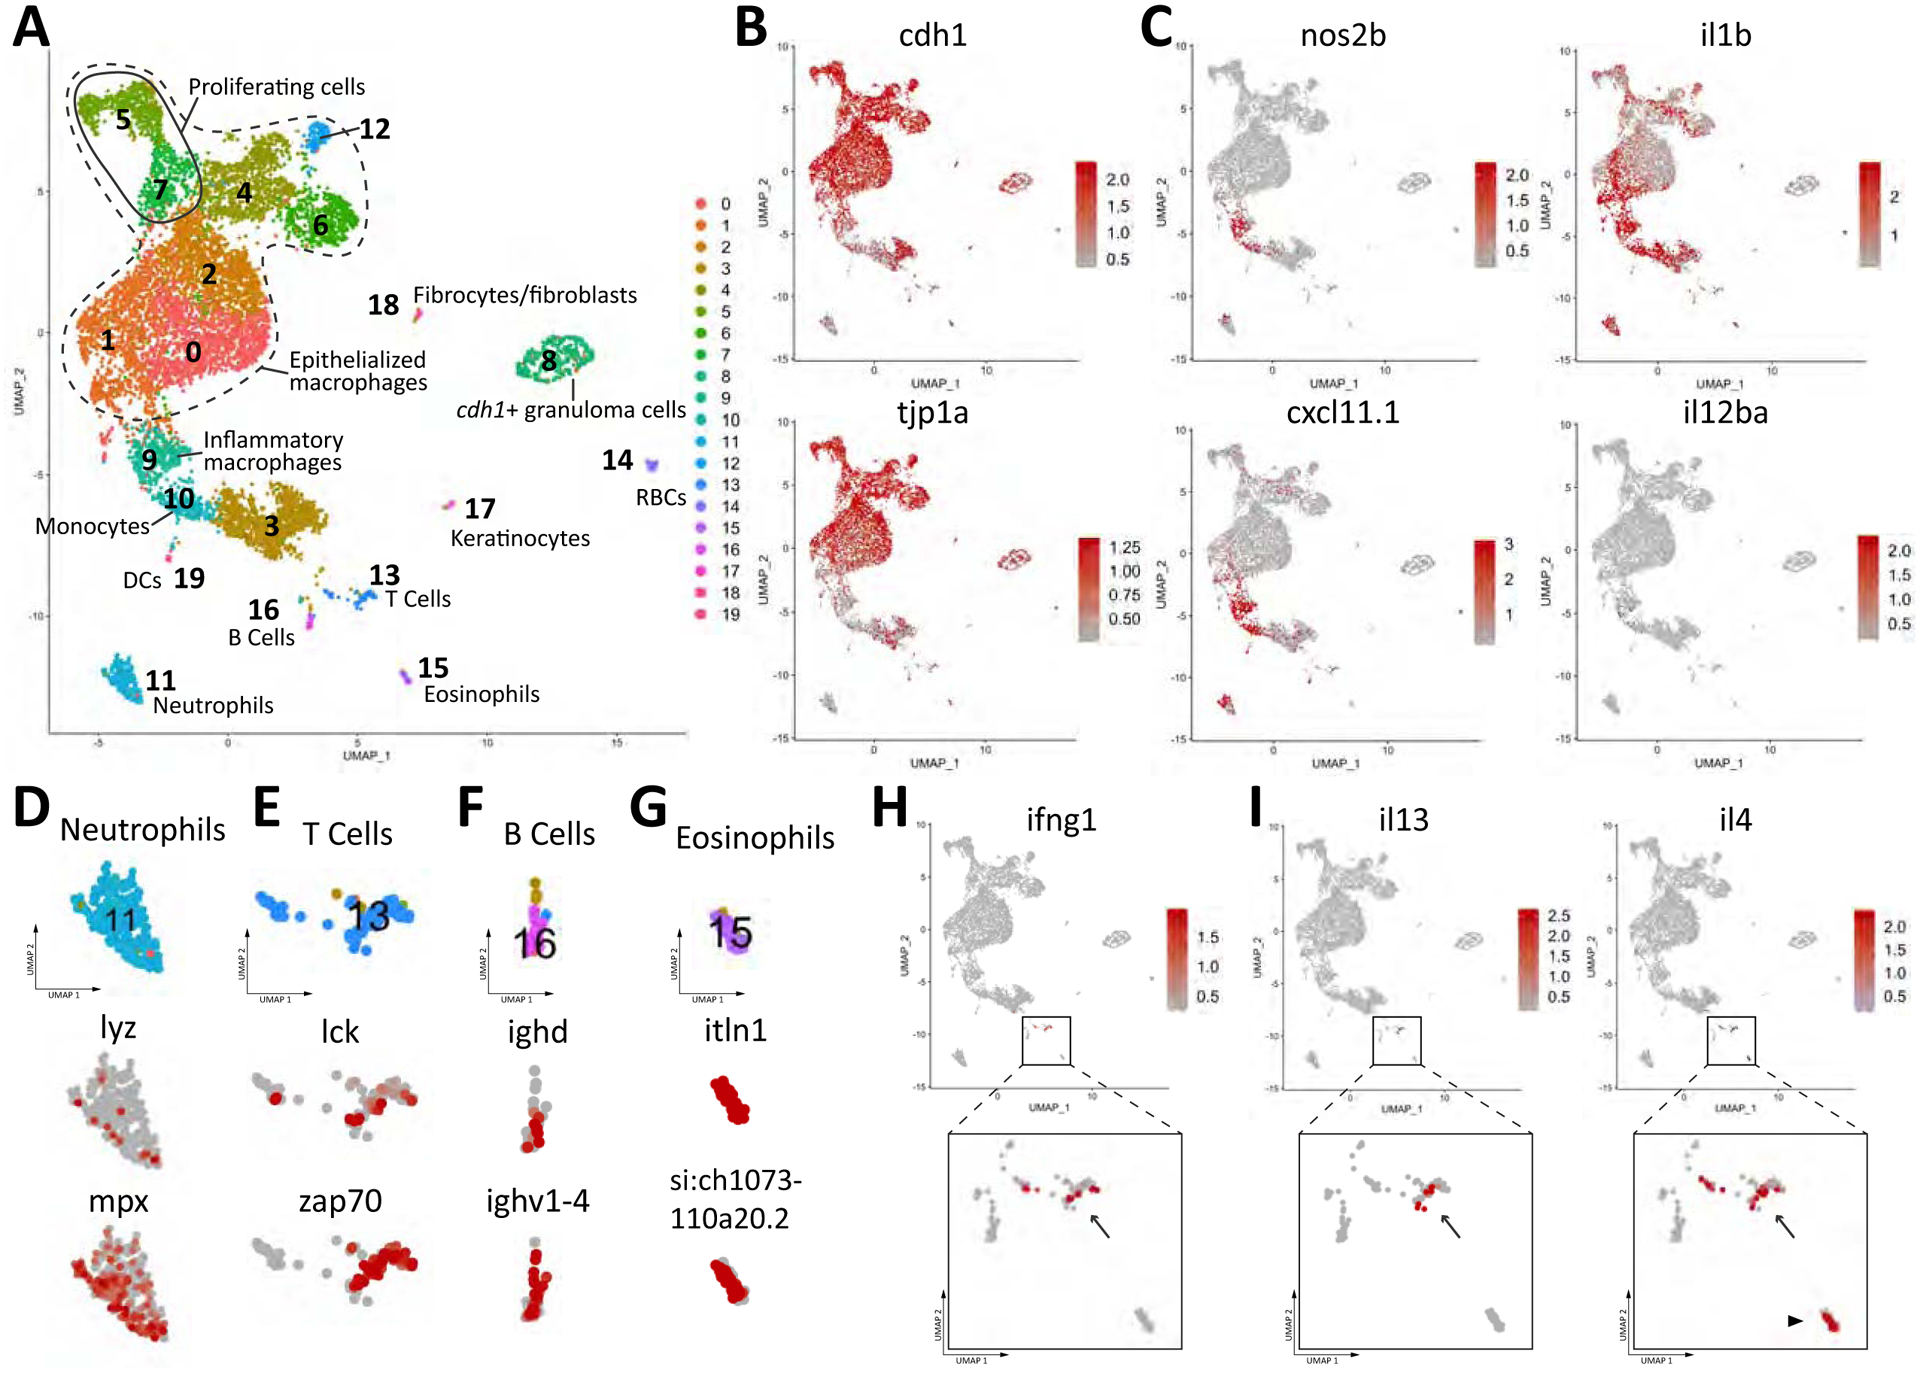
(A) UMAP plot of scRNA-seq data of 9273 cells from dissociated granulomas. (B) Expression map of the epithelial markers E-cadherin and ZO-1 (tjp1a) in cell populations isolated from the granuloma. (C) Expression maps of inflammatory markers within the cell populations of the granuloma. (D-G) Marker gene expression in individual clusters identifying these clusters as (D) neutrophils, (E) T cells, (F) B cells, and (G) Eosinophils. (H and I) Expression of type 1 and type 2 markers, respectively, within T cell (arrow) and eosinophil (arrowhead) populations. (H) IFN-γ. (I) IL-4 and IL-13.