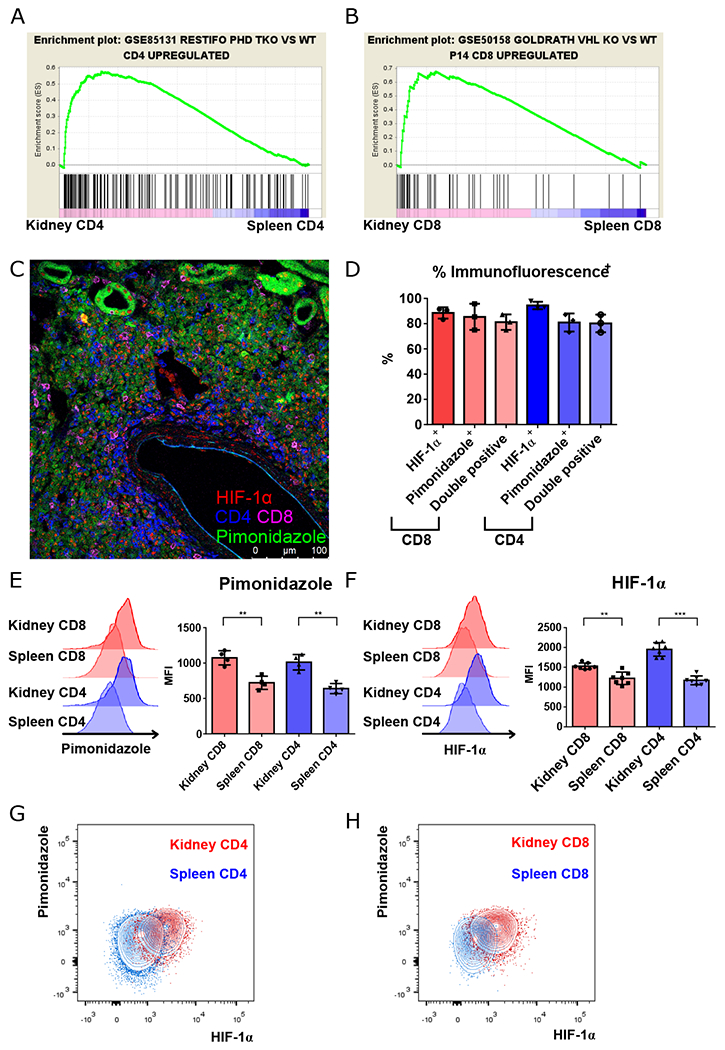
Fig. 1. Renal-infiltrating T cells are located in areas of hypoxia.

A, B. GSEA plots comparing gene signatures of renal-infiltrating CD4+ and CD8+ T cells, to splenic to CD4+ and CD8+ T cells, respectively, based upon the hypoxia signatures generated by comparing triple PHD (prolyl-4-hydroxylase domain proteins)-knockout CD4+ to wild type CD4+ T cells, and comparing VHL (Von-Hippel Lindau) tumor suppressor knockout CD8+ T cells to lymphocytic choriomenigitis virus specific P14 TCR transgenic CD8+ T cells taken from virally-infected mice. C. Representative confocal microscopy of lymphocytic aggregates of CD4+ (blue) and CD8+ T cells (magenta) with HIF-1α nuclear staining (red) located in regions of hypoxia (pimonidazole, green). D. Summary of nuclear HIF-1α and pimonidazole staining, and combined staining of CD4+ and CD8+ T cells within renal lymphocytic aggregates. E, F. Representative data and summary of pimonidazole and HIF-1α staining of activated (CD44hi) splenic vs. renal CD4+ and CD8+ T cells isolated from kidneys of 16-18-week-old MRL/lpr mice (n = 4 and 8, respectively). G, H. Representative data of pimonidazole and HIF-1α staining in kidney versus spleen CD4+ (G) and CD8+ T cells (H) as in (E) and (F). Representative of 3 experiments, n = 4 to 8 animals per group. Data shown are mean ± s.d.; statistical analysis by two-tailed paired t-test (E, F). **p < 0.01, ***p < 0.001.
