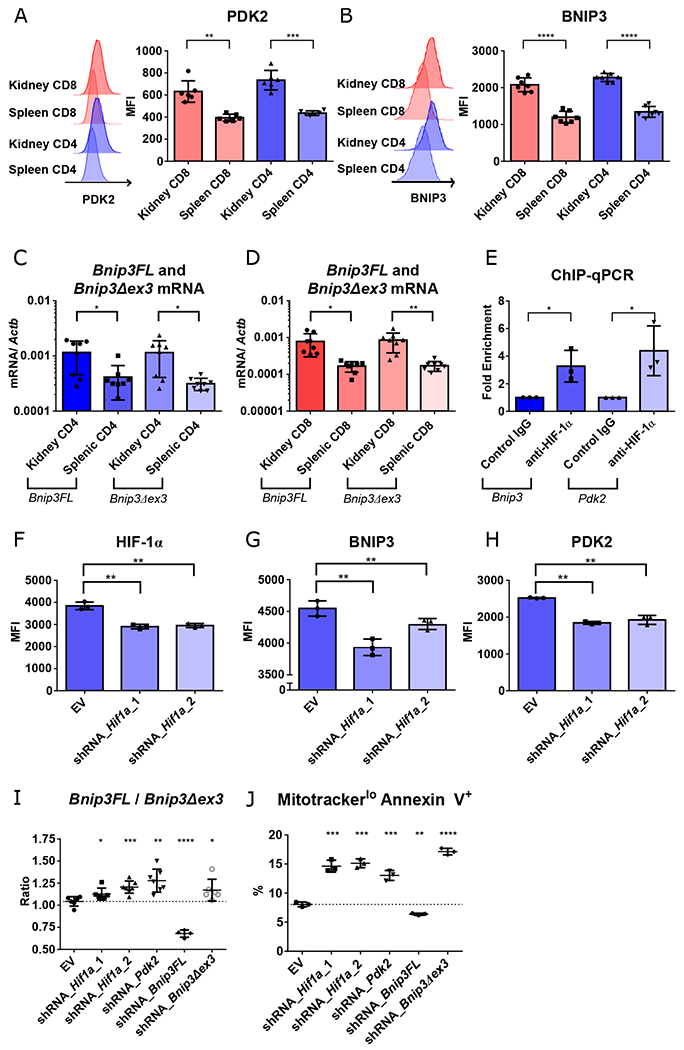
Fig. 2. Renal T cells survive in hypoxia through Bnip3 alternative splicing mediated by HIF-1 dependent PDK2.

A-B. Representative data and summary of PDK2 (A) and BNIP3 (B) expression in activated (CD44hi) splenic vs. renal CD4+ and CD8+ T cells isolated from kidneys of 16-18-week-old MRL/lpr mice (n = 6, 7, respectively). C-D. Quantification of two forms of Bnip3 transcripts, full length (Bnip3FL) and exon 3 deleted (Bnip3Δex3) in CD4+ (C) and CD8+ T cells (D) (n = 8). E. Binding of HIF-1α to Bnip3 and Pdk2 promoter regions, as determined by chromatin immunoprecipitation (ChIP) and quantitative real-time PCR (qPCR). F-H. Mean fluorescence intensity of HIF-1α (F), BNIP3 (G), and PDK2 (H) in Th1-activated CD4+ T cells transduced with empty vector (EV), or two different constructs of Hif1α knockdowns after 2 days in hypoxic cultures. I. Ratio of Bnip3FL and Bnip3Δex3 mRNAs in Th1-activated CD4+ T cells transduced with either EV or knockdown constructs targeting Hif1a, Pdk2, Bnip3FL, or Bnip3Δex3 one day after adding DMOG. J. Percentage of mitotracker deep redlo annexin V+ cells of Th1-activated CD4+ T cells transduced with knockdown vectors after 3 days of hypoxic culture. Data shown are mean ± s.d.; statistical analysis by two-tailed paired t-test (A-E) and unpaired t-test (F-J). *p < 0.05, **p < 0.01, ***p < 0.001, ****p < 0.0001.
