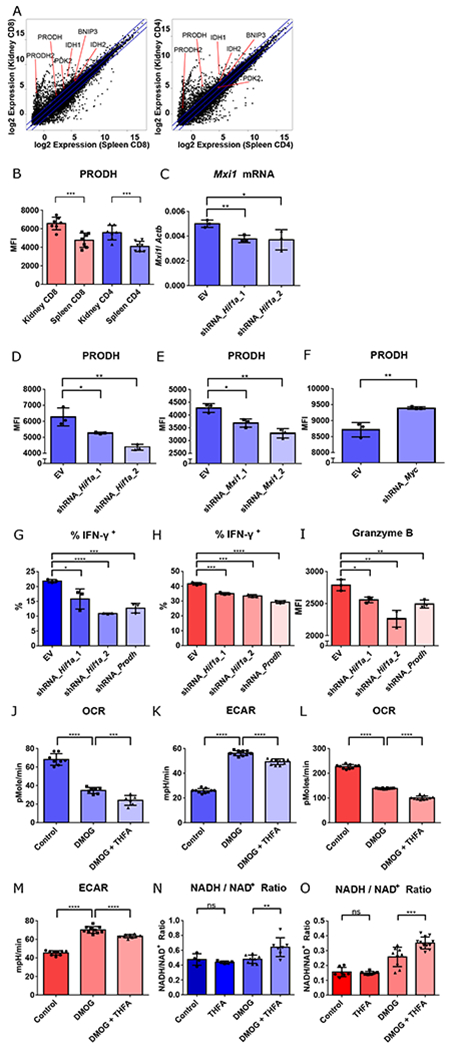
Fig. 3. T cell effector function in hypoxia is mediated by HIF-1 regulated proline metabolism facilitating glycolysis.

A. RNA-seq gene expression (mean) of splenic vs. renal CD8+ and CD4+ T cells isolated from kidneys of 14-week-old MRL/lpr mice. B. PRODH expression in activated (CD44hi) splenic vs. renal CD4+ and CD8+ T cells isolated from kidneys of 16-18-week-old MRL/lpr mice (n = 7). C. Mxi1 mRNA in Th1-activated CD4+ T cells transduced with either empty vector (EV), or knockdown constructs targeting Hif1a one day after adding DMOG. D-F. Mean fluorescence intensity of PRODH in Th1 activated CD4+ T cells transduced with EV, or two different Hif1a knockdown constructs (D), two different Mxi1 knockdown constructs (E), or Myc knockdown constructs (F) after 2 days of hypoxic culture. G, H. Percentage of IFN-γ+ cells of the live Th1 activated CD4+ T cells, and activated CD8+ T cells, transduced with the different knockdown vectors after 3 days (for CD4+ T cells) or 1 day (for CD8+ T cells) of hypoxia culture. I. Mean fluorescence intensity (MFI) of granzyme B in live activated CD8+ T cells transduced with the different knockdown vectors after one day of hypoxia culture. J-K. Baseline OCR (J) and extracellular acidification rate (ECAR) (K) of control-, DMOG-, DMOG- and THFA-treated Th1-activated CD4+ T cells. L-M. Baseline OCR (L) and extracellular acidification rate (ECAR) (M) of control-, DMOG-, DMOG- and THFA-treated CD8+ T cells N-O. NADH/ NAD+ ratio of control-, THFA-, DMOG-, DMOG- and THFA-treated Th1-activated CD4+ T cells (N) and CD8+ T cells (O). Data shown are mean ± s.d.; statistical analysis by two-tailed paired t-test (B) and unpaired t-test (C-O). ns = p > 0.05, *p < 0.05, **p < 0.01, ***p < 0.001, ****p < 0.0001.
