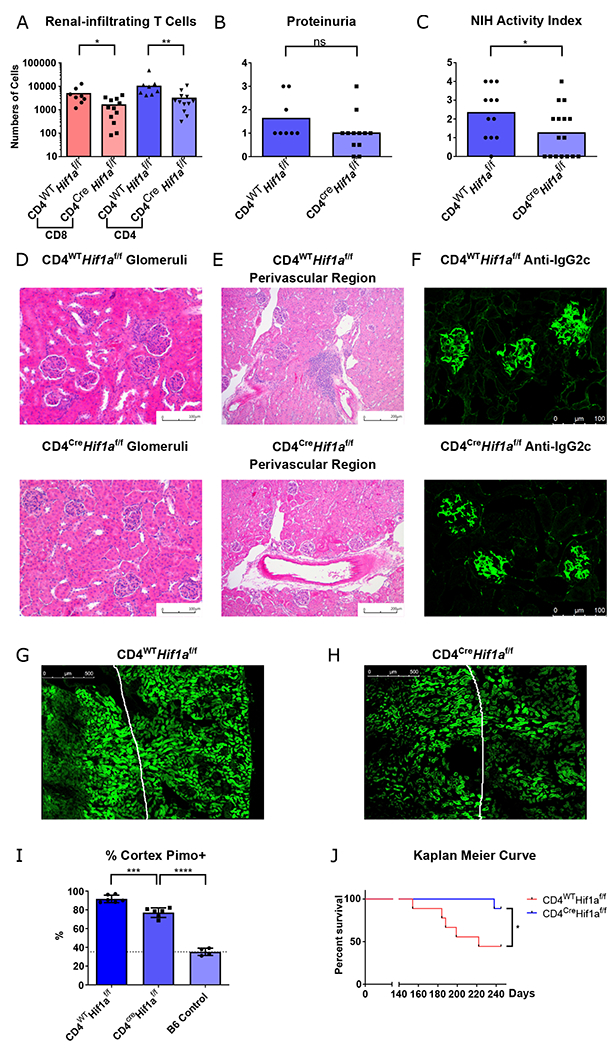
Fig. 5. Genetic ablation of HIF-1α in T cells eliminates infiltrating T cells in lupus nephritis, reverses hypoxia, and prolongs survival.

A. Numbers of renal-infiltrating CD4+ and CD8+ T cells isolated from 6-month-old Cd4cre.Hif1afl/fl and Hif1afl/fl B6.Sle1.Yaa male mice (n = 12 and 8, respectively). B. Semi-quantitative urine dipstick analysis for proteinuria the same mice as (A) C. Pathological scores of the same mice using the NIH activity index for total NIH activity index(C) (n = 16, 12, respectively). D-F. Representative glomerular (D), perivascular aggregates near the corticomedullary junction (E), and immunofluorescence staining of glomerular IgG2c (F) from the same mice. G-I Representative pimonidazole (Hypoxyprobe) staining of kidney sections and quantification of pimonidazole positive renal tubular cells in the cortex. Reference line represents the pimonidazole staining in renal cortex of control B6 mice n = 6, 6 and 4 respectively. J. Kaplan Meier survival curve of Cd4cre.Hif1afl/fl and Hif1afl/fl B6.Sle1.Yaa male mice, n = 9 animals each group. Data shown are mean ± s.d.; statistical analysis by two-tailed t-test (A-C) and log-rank test (J) ns = p > 0.05, *p < 0.05, **p < 0.01, ***p < 0.001, ****p < 0.0001.
