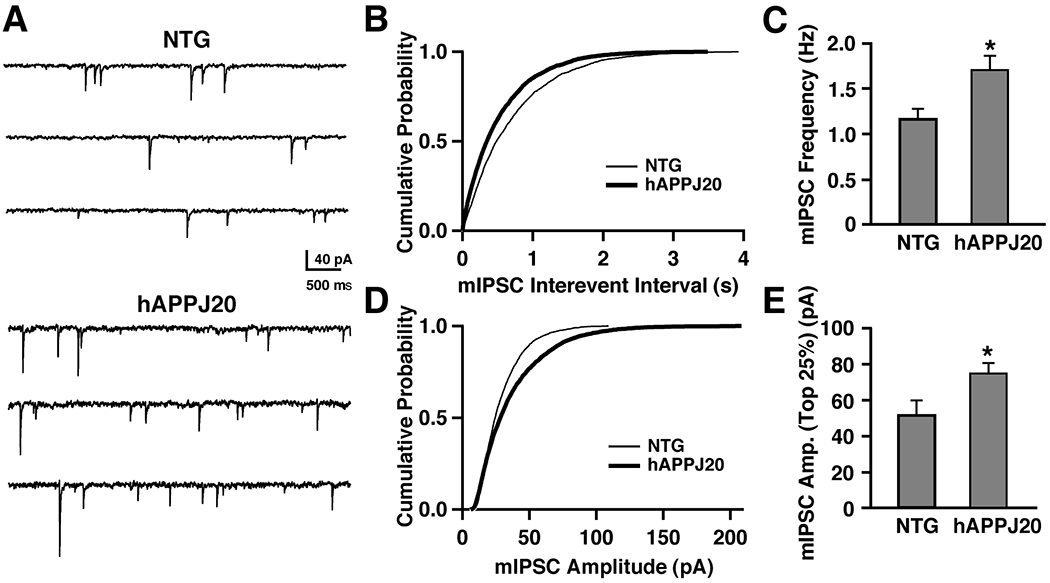
Figure 3. Increase in mIPSC frequency and large-amplitude mIPSCs in dentate gyrus slices from hAPP-J20 mice.

(A) Representative traces of mIPSCs recorded from NTG (top) and hAPP-J20 (bottom) mice. (B) Average cumulative probability plot of mIPSC interevent intervals for NTG (thin line, n = 7 cells, 3 mice) and hAPP-J20 (thick line, n = 10 cells, 3 mice) mice shows decreased interevent intervals in hAPP-J20 mice. (C) mIPSC frequency was significantly increased in hAPP-J20 mice (NTG, n=7 cells, 3 mice; hAPP-J20, n=10 cells, 3 mice). (D) Average cumulative probability plot of mIPSC amplitudes recorded from NTG (thin line, n = 7 cells, 3 mice) and hAPP-J20 (thick line, n = 10 cells, 3 mice) mice shows enhanced number of large-amplitude mIPSCs. (E) The largest 25% of mIPSCs were increased in amplitude in the hAPP-J20 mice. (n=10 cells, 3 mice) relative to NTG controls (n=7 cells, 3 mice). *P<0.05 by Student’s t test.
