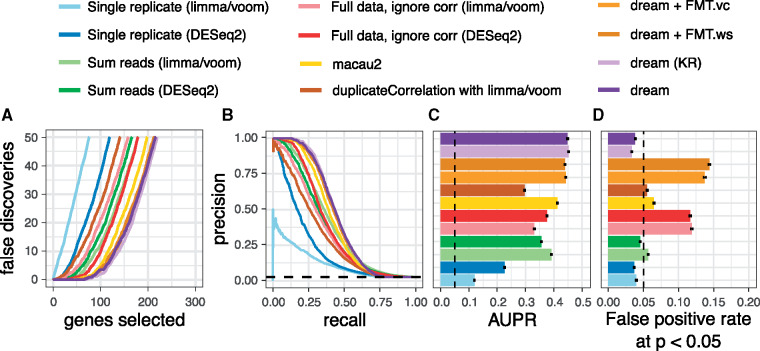
Fig. 1.
Performance on biologically motivated simulated data. (A, B, C, D) Performance from 50 simulations of RNA-seq datasets of 14 individuals each with 3 replicates. (A) False discoveries plotted against the number of genes called differentially expressed by each method. (B) Precision–recall curve showing performance in identifying true differentially expressed genes. Dashed line indicates performance of a random classifier. (C) Area under the precision–recall (AUPR) curves from (B). Dashed line indicates AUPR of a random classifier. Error bars indicate 95% confidence intervals, and we note that the intervals are very small. (D) False positive rate at P < 0.05 evaluated under a null model were no genes are differentially expressed illustrates calibration of type I error from each method. As indicated by the dashed line, a well calibrated method should give P-values < 0.05 for 5% of tests under a null model

