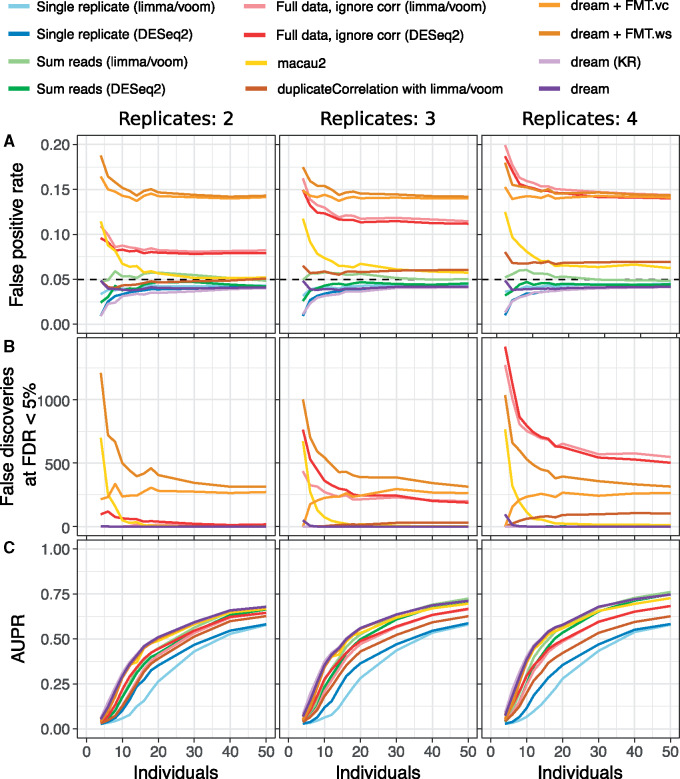
Fig. 2.
Performance summary for simulations with a range of individuals and replicates. Simulations were performed on 4–50 individuals with between 2 and 4 replicates. For each condition, 50 simulations were performed for a total of 1800. (A) False-positive rate at P < 0.05 for simulations versus the number of individuals and replicates. Black dashed line indicates target type I error rate of 0.05. (B) Number of genes passing FDR cutoff of 5% under the null simulations. Values shown are averaged across 50 simulations. (C) AUPR for simulations versus the number of individuals and replicates

