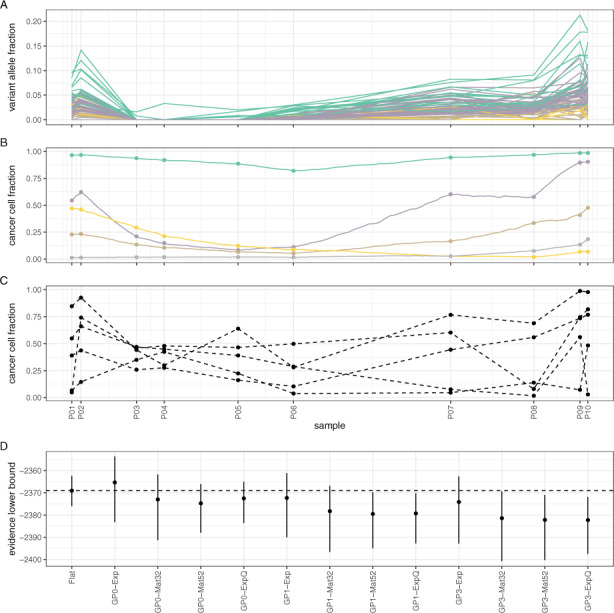
Fig. 5.

Assessing model performance using data from a liquid biopsy on a subject with melanoma (Cutts et al., 2017). (A) Observed VAF values for each somatic mutation over 13 months of treatment and their cluster assignments (colours are the same as in B). B) Mutation clusters identified by model GP0-Exp (due to extensive overlap, credible intervals are omitted for clarity). (C) Mutation clusters identified by the Flat model. (D) Comparative performance of various models. Model GP0-Exp performs comparably to Flat
