
Figure 1.
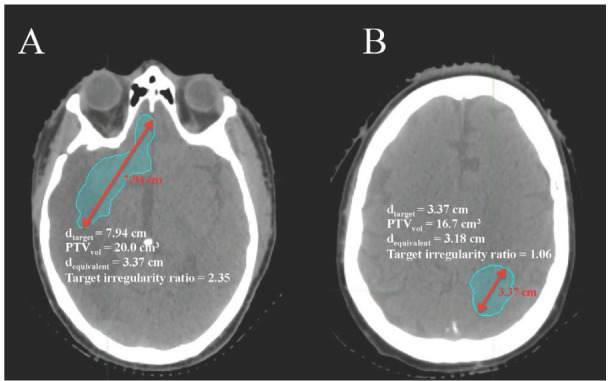
Axial CT slices with targets representing (A) the highest target irregularity ratio 2.35 and (B) the lowest target irregularity ratio 1.06.
Official websites use .gov
A
.gov website belongs to an official
government organization in the United States.
Secure .gov websites use HTTPS
A lock (
) or https:// means you've safely
connected to the .gov website. Share sensitive
information only on official, secure websites.
Axial CT slices with targets representing (A) the highest target irregularity ratio 2.35 and (B) the lowest target irregularity ratio 1.06.