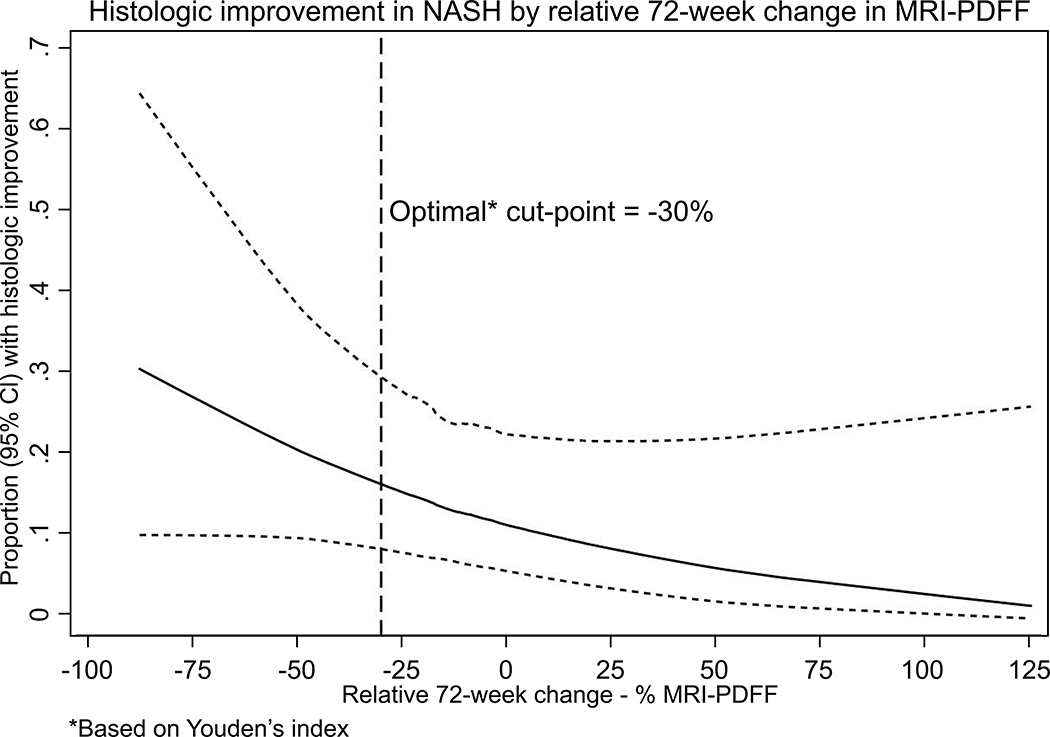
Figure 1: Histologic response in NASH increases as relative decline in MRI-PDFF increases.
The y axis represents the proportion of patients who achieved histologic response and the X-axis denotes relative change (decrease towards the left and increase towards the right) in MRI-PDFF. These data include both the OCA and the placebo group. The dotted vertical line represents the optimal cut-point for MRI-PDFF decline at 30% (p-value < 0.05%)

