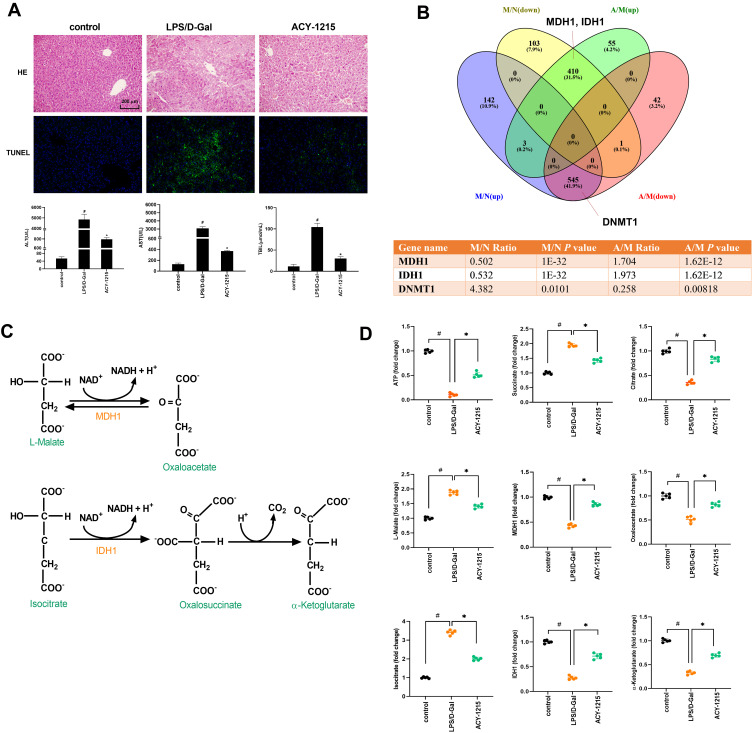
Figure 2.
The effect of ACY-1215 on LPS/D-Gal induced ALF mice. (A) HE staining was used to detect histopathological changes in liver. TUNEL staining was used to detect the cell apoptosis level. The serum levels of ALT, AST, and TBIL were detected. (B) Venn diagram showing the protein quantitative sequencing. (A) ACY-1215 intervention group. M: Model group. N: Control group. M/N (up/down) represented the protein whose expression level was increased (decreased) in the model group compared with the normal group. A/M (up/down) represented the protein whose expression level was increased (decreased) in the ACY-1215 intervention group compared with the model group. The table showed different expression levels of MDH1, IDH1 and DNMT1 in different mice groups. (C) The substrate and product of MDH1 were L-Malate and Oxaloacetate. The substrate and product of IDH1 were Isocitrate and α-Ketoglutarate. (D) The levels of ATP, Oxaloacetate, MDH1, α-Ketoglutarate, Citrate, MDH1, L-Malate, Isocitrate and Succinate in liver were tested. Data are shown as mean ± SD. #P < 0.05, compared with the control group. *P < 0.05, compared with the LPS/D-Gal group.

