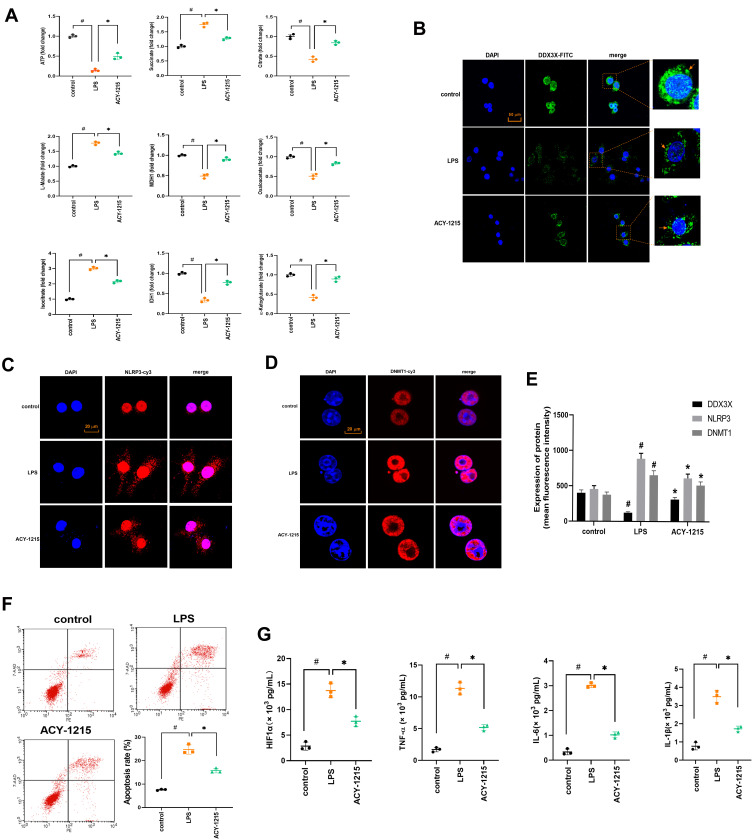
Figure 5.
The effect of ACY-1215 on energy metabolite in LPS induced RAW264.7 cells. (A) The levels of ATP, Oxaloacetate, MDH1, α-Ketoglutarate, Citrate, MDH1, L-Malate, Isocitrate, and Succinate in RAW264.7 cells was tested. (B–D) The levels of DDX3X, NLRP3, and DNMT1 were detected by immunofluorescence. (E) A histogram was used to show the protein level of DDX3X, NLRP3 and DNMT1. (F) Cell apoptosis was detected by flow cytometry. (G) The levels of HIF1α, TNF-α, IL-6, and IL-1β in cell were tested by ELISA kits. Data are shown as mean ± SD. #P < 0.05, compared with the control group. *P < 0.05, compared with the LPS group.

