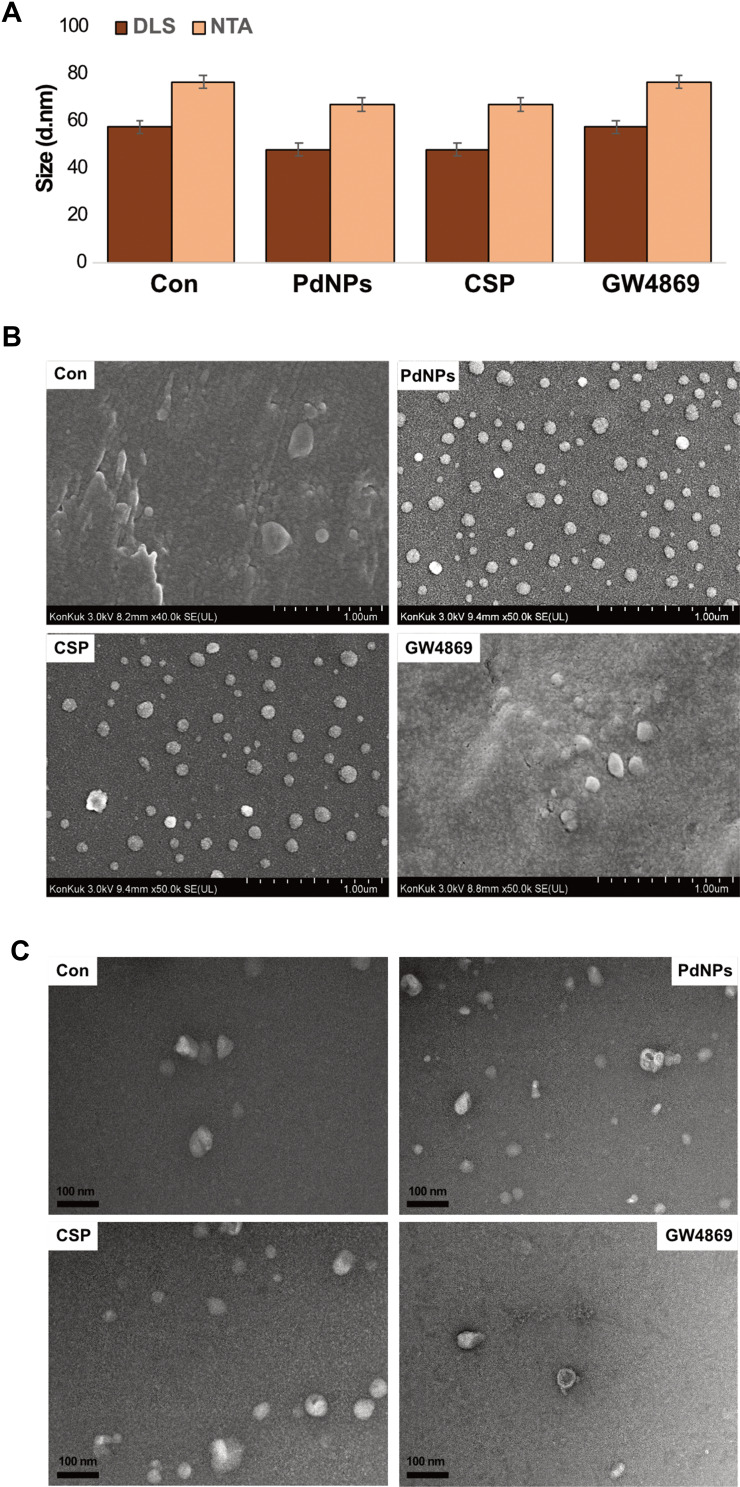
Figure 10.
Size, size distribution, and morphological analyses of exosomes. THP-1 cells were treated with PdNPs (15 µM), CSP (10 µM), or GW4869 (20 µM) in RPMI-1640 cell culture medium supplemented with 1% FCS for 24 h. (A) Size distribution of exosomes was determined using DLS and NTA. (B) SEM images of exosomes. (C) TEM images of exosomes. At least three independent experiments were performed for each sample, and reproducible results were obtained.

