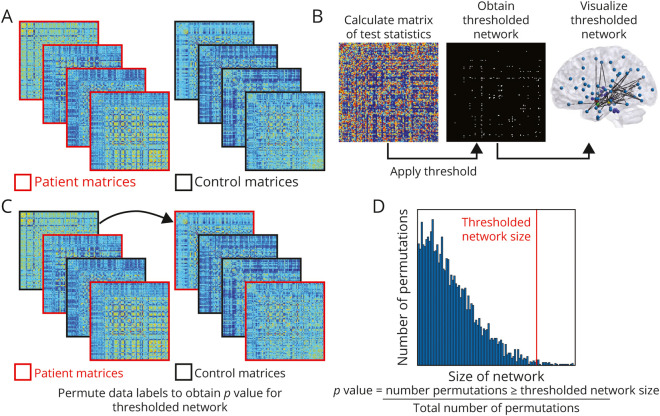
Figure 3. Calculation of the Network-Based Statistic in Patients With Temporal Lobe Epilepsy and Controls.
(A) Functional connectivity matrices for each participant are calculated. (B, left) A test statistic (t test) is calculated at each cell of the connectivity network. Then network components of interest are identified using a primary threshold of t statistic > 4.2, 4.4, 4.6. This thresholded network can be visualized in a matrix (B, middle) where white cells represent suprathreshold links or in a schematic diagram (B, right) where connected nodes represent the suprathreshold network components. (C) Random permutation of data labels (10,000 permutations) across participants is then applied to calculate family-wise error. (D) After the calculations are repeated on every permutation, a null distribution is generated, and family-wise error rate at desired level of p < 0.01 is controlled in the final result.

