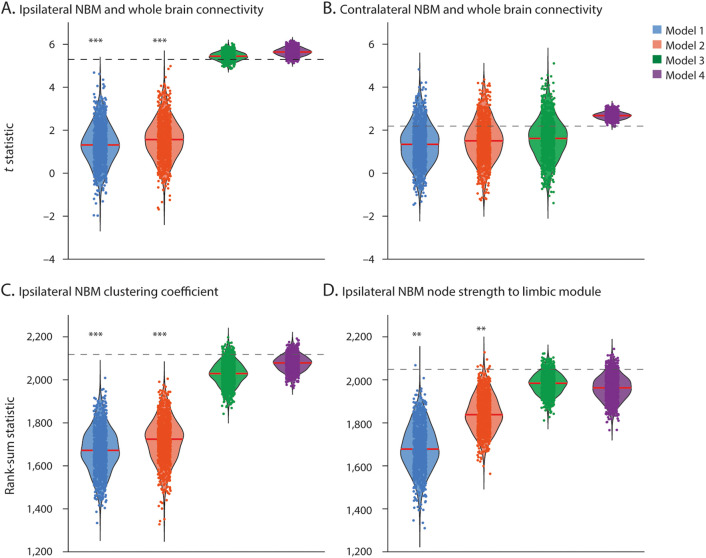
Figure 5. Network Models Explain Connectivity Differences Between Patients With TLE and Controls.
Data points represent test statistics (t statistic for normally distributed data or rank-sum statistic for nonnormally distributed data) quantifying differences between patient and control null models (1,000 data points per null model). Dashed line represents the original data test statistic. Models with sufficient data points above the line represent network models that capture the difference between patients and controls observed in empirical data. (A) Reduced connectivity of ipsilateral nucleus basalis of Meynert (NBM) with the whole brain is best explained by models 3 and 4, while (B) reductions in contralateral NBM connectivity with the whole brain are explained equally well by all models. Decreases in (C) ipsilateral NBM clustering coefficient and (D) ipsilateral NBM node strength to limbic module are best explained by models 3 and 4. The 4 models are defined in the Methods section. Red line shows median. N = 1,000 comparisons per model. ***p < 0.001, **p < 0.01, t statistic or rank-sum statistic.

