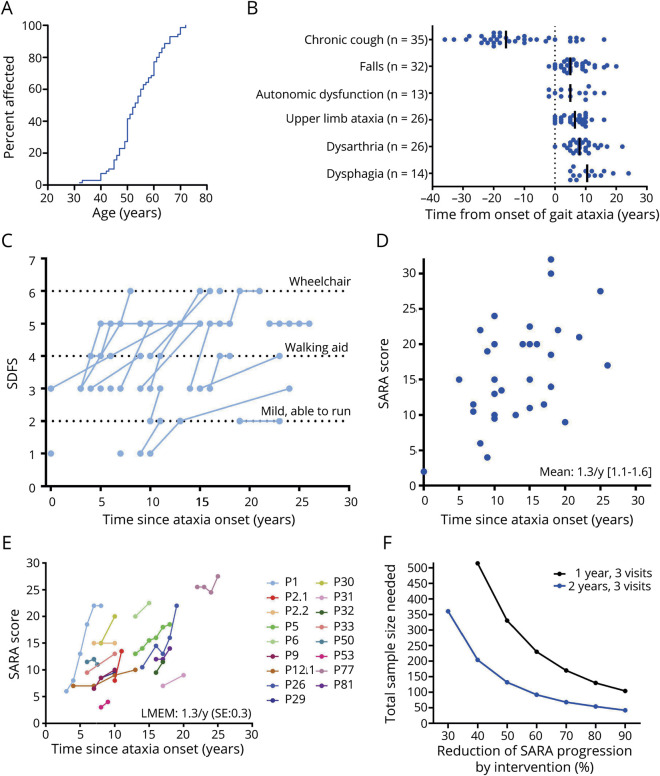
Figure 6. Feature Evolution and Disease Progression.
(A) Onset of ataxia in replication factor complex subunit 1 disease is relatively late (compared to other recessive ataxias),26 with 50% of patients affected by 54 years of age. (B) Temporal evolution of ataxia and nonataxia features relative to onset of gait ataxia (dotted line). (C) Cross-sectional and longitudinal functional disease progression as indicated by the Spinocerebellar Degeneration Functional Score (SDFS; n = 33). (D) Cross-sectional progression of ataxia indicated by the individual Scale for the Assessment and Rating of Ataxia (SARA) score at the last assessment relative to ataxia duration (n = 32). (E) Prospective longitudinal progression of ataxia (n = 17). Comparable ataxia severities (e.g., P32 vs P50, or P9 vs P31) and phases of accelerated progression (e.g., P1, P26) occur after interindividually variable durations of ataxia. (F) Sample size estimations for the detection of reduced SARA score progression in parallel-group (1:1) interventional trials with 3 visits in observation periods of either 1-year (0, 6, and 12 months) or 2-year (0, 12, and 24 months) duration. LMEM = linear mixed effect model; SE = standard error.

