
Figure 1. Clustering and Variability of Blinded Review of Melt Curves From DBS Samples.
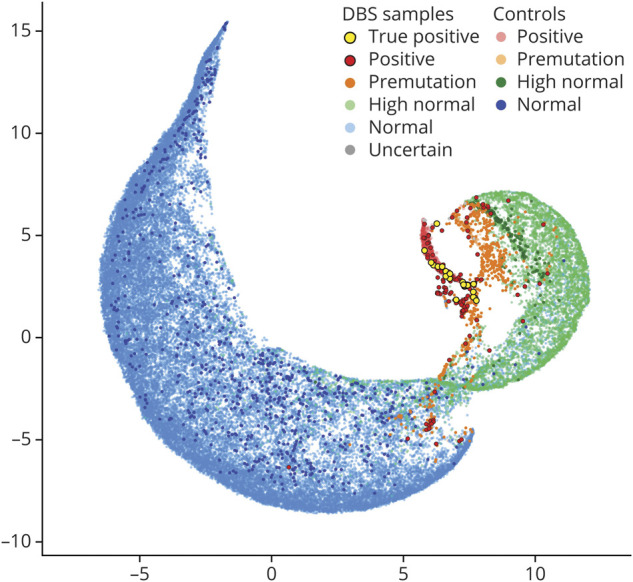
The −dF/dT data from 87.25°C to 96.70°C were clustered by Uniform Manifold Approximation and Projection and visualized as a 2-dimensional representation. Fifty thousand three hundred eighty-two dried blood spot (DBS) samples and 1,038 expanded (5::75, 5::80, 5::480, and 5::2,530), 259 premutation (12::37), 258 high normal (14::30), and 779 normal (5::5, 5::13, and 5::14) control melt profiles were used with sample points colored by the consensus call of blinded reviewers.