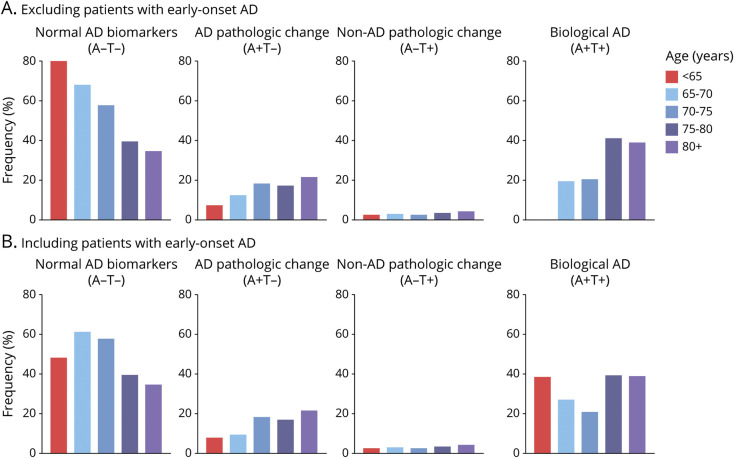
Figure 3. Frequency of Biologically Defined Alzheimer Disease (AD) Spectrum Entities Stratified by Age.
Frequency of AD biomarkers rises with age. Individuals are grouped by AD biomarker status, with colored bars representing each age group. (A) Tau positivity defined in the temporal meta–region of interest. Individuals below the age of 65 were the most likely to be AD biomarker–negative (p < 0.0001). Correspondingly, the likelihood of being AD biomarker–negative decreased with each age group. In contrast, the frequency of biologically defined AD (A+T+) increased with age (p < 0.0001). There was no statistically significant association between non-AD pathologic change and age (p = 0.3). (B) When defining tau positivity using Braak I–II regions, we observed a higher frequency of the A−T+ biomarker profile until age 75. We also observed higher frequency of the A+T+ biomarker profile. Individuals with early-onset AD are excluded from this figure and presented in supplementary figure 3 (available at doi.org/10.5061/dryad.69p8cz8zr).

