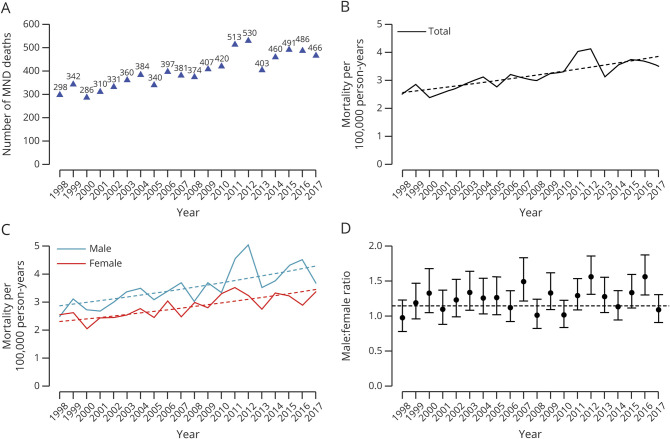
Figure 2. Time Trends in MND Mortality and Sex Ratios in the Netherlands From 1998 Through 2017.
(A) Number of motor neuron disease (MND) deaths observed in the Netherlands between 1998 and 2017. Absolute number of MND deaths increased from 299 in 1998 to 466 in 2017 with an average annual increase of 2.6%. (B) Adjusted for population size, mortality rates increased by 53.2% or by 14.1% After additional age and sex adjustment (both p < 0.001) in the time period of 1998 to 2017, dashed lines indicate regression lines. (C) MND mortality rates are provided separately for men (blue) and women (red). Annual increase in MND mortality rates was not different for men and women (p = 0.62 for interaction term). (D) Similar to panel C, we provide the annual male:female ratio, revealing a stable sex ratio of 1.19 (dashed line) over time (p = 0.09 for time trend).

