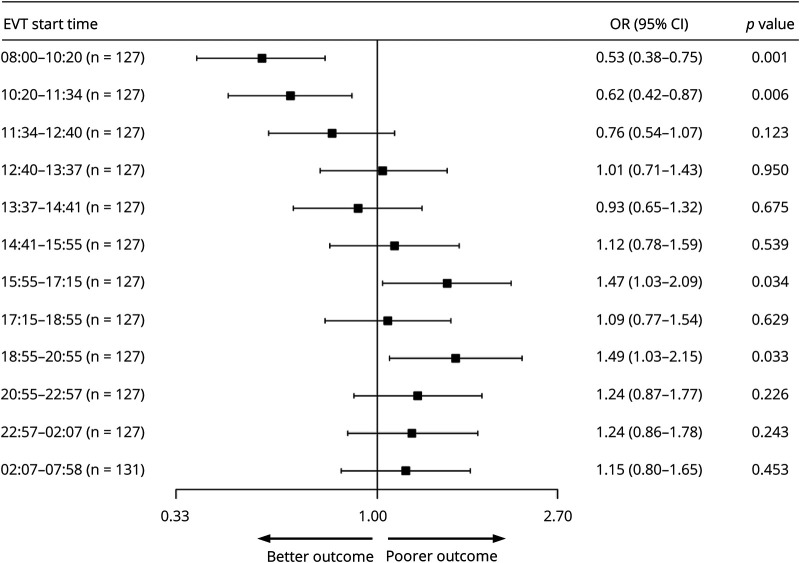
Figure 1. Analysis of the Primary End Point.
The forest plot shows the effect size in the primary end point (common odds ratio for improvement on the modified Rankin Scale at 90 days, analyzed according to ordinal logistic regression and adjusted for age, symptom onset to endovascular therapy (EVT) start time, age, NIH Stroke Scale score, modified Treatment in Cerebral Ischemia score, and prestroke modified Rankin Scale score) across all EVT start time cohorts. There are significant differences in the morning cohorts at 08:00–10:20 and 10:20–11:34, suggesting better functional outcome at 3 months, as well as in the end of work day cohorts at 15:55–17:15 and 18:55–20:55, suggesting poorer functional outcome at 3 months. CI = confidence interval; OR = odds ratio.

