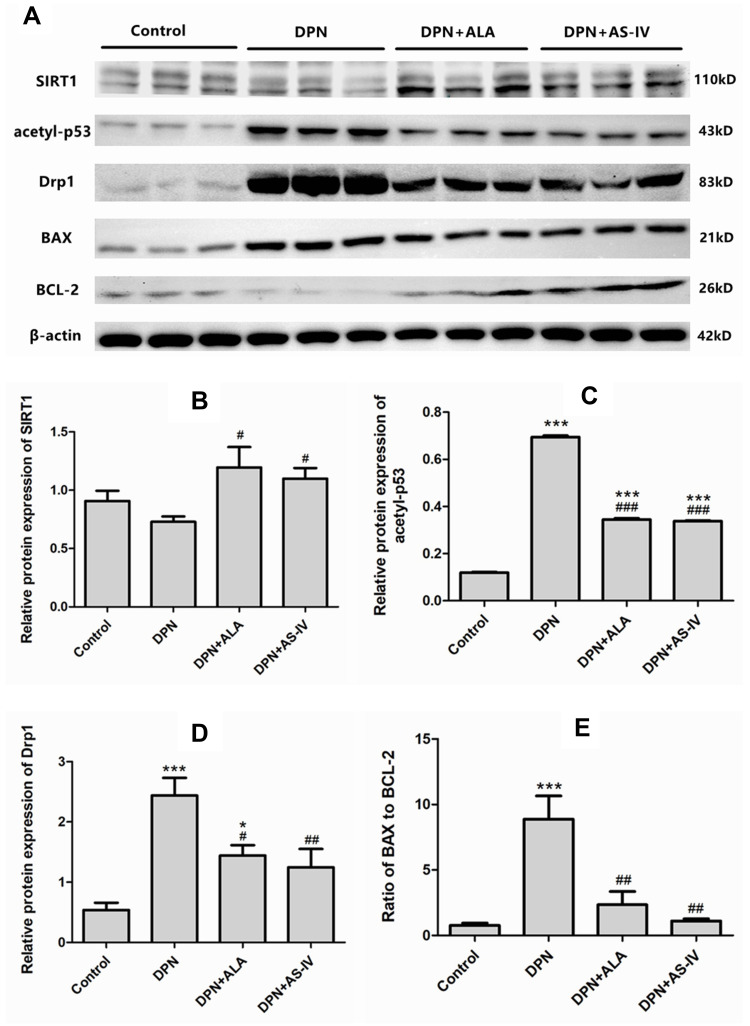
Figure 10.
Western blot analysis of SIRT1, acetyl-p53, Drp1, BAX, BCL-2.
Notes: (A) Films of SIRT1, acetyl-p53, Drp1, BAX, BCL-2, and β-actin bands. (B–D) Levels of SIRT1 (B), acetyl-p53 (C), Drp1 (D) expressed as the optical density value normalized to β-actin. (E) Ratio of optical density value of BAX to BCL-2. Data are represented as mean ± SD. *P < 0.05, ***P < 0.001 vs control group. #P < 0.05, ##P < 0.01, ###P < 0.001 vs DPN group.
Abbreviations: SD, standard deviation; DPN, diabetic peripheral neuropathy; AS IV, astragaloside IV; ALA, α-lipoic acid.

