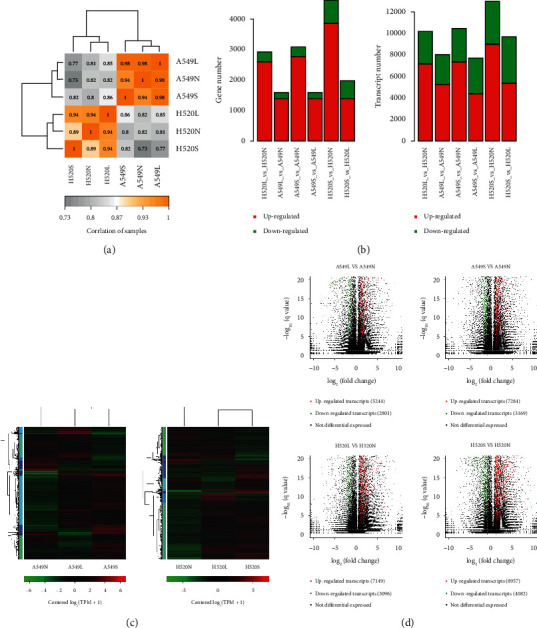
Figure 2.

The results of NSCLC RNA-seq. (a) Heat map of correlation between samples. (b) Analysis and statistics of gene and Transcription expression difference. The horizontal axis is the name of difference comparison, and the vertical axis is the number of up-down difference genes. Among them, the green is downregulated counts and the red is upregulated counts. (c) Heatmaps of differential expressed genes (DEGs) and differential expressed transcripts (DETs) in NSCLC cells under different oxygen concentrations. On the left is the tree diagram of gene clustering. (d) Transcripts volcano maps of H520 and A549 cells compared with 21% O2VS 5% O2 and 21% O2VS 1% O2.
