Fig. 1.
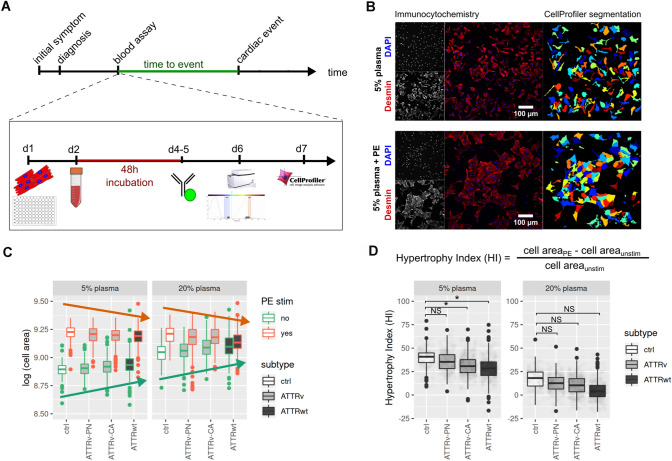
Overview of the experimental setup. a Timeline and Assay workflow is depicted. Blood plasma from patients was collected during routine visit, and events during follow-up (decompensation, transplantation and dead) were prospectively documented. After seeding cardiomyocytes at day 1, the culture medium was replaced after 24 h (h) with 5% or 20% patient plasma and treated additionally with or without phenylephrin. After another 48 h the cellular growth was stopped by fixation and the cells were stained as described in the “Methods” section. Data acquisition and analysis was performed in an automated setup. b Representative immunohistological specimen (left) are shown for NRCMs incubated with 5% human control plasma without (top) or with additional phenylephrine (PE) treatment (bottom). Cells were stained with Desmin antibody (red) and DAPI for nuclei detection (blue). The corresponding automated area recognition by the software is shown on the right. c Quantification of cell size after plasma treatment (5% left; 20% right) for unstimulated condition (green frame of the box plots) and after PE treatment (red frames of the box plots) is shown for controls and ATTR amyloidosis patients (ATTRv-PN, ATTRv-CA, ATTRwt). The red arrow illustrates a slight decrease of cell size after PE stimulation in between the groups. The green arrow illustrates a slight increase of cell size under basal condition in between the groups d The formula for hypertrophy index (HI) calculation is depicted on top. HI for 5% and 20% plasma stimulation is shown below. “Star” indicates significantly different values, p < 0.05, NS: indicates not significantly different values. Please note: for illustrative reasons data are presented as relative cell size. For statistics, however, log-transformed values were used. Data were attained from three independent experiments

