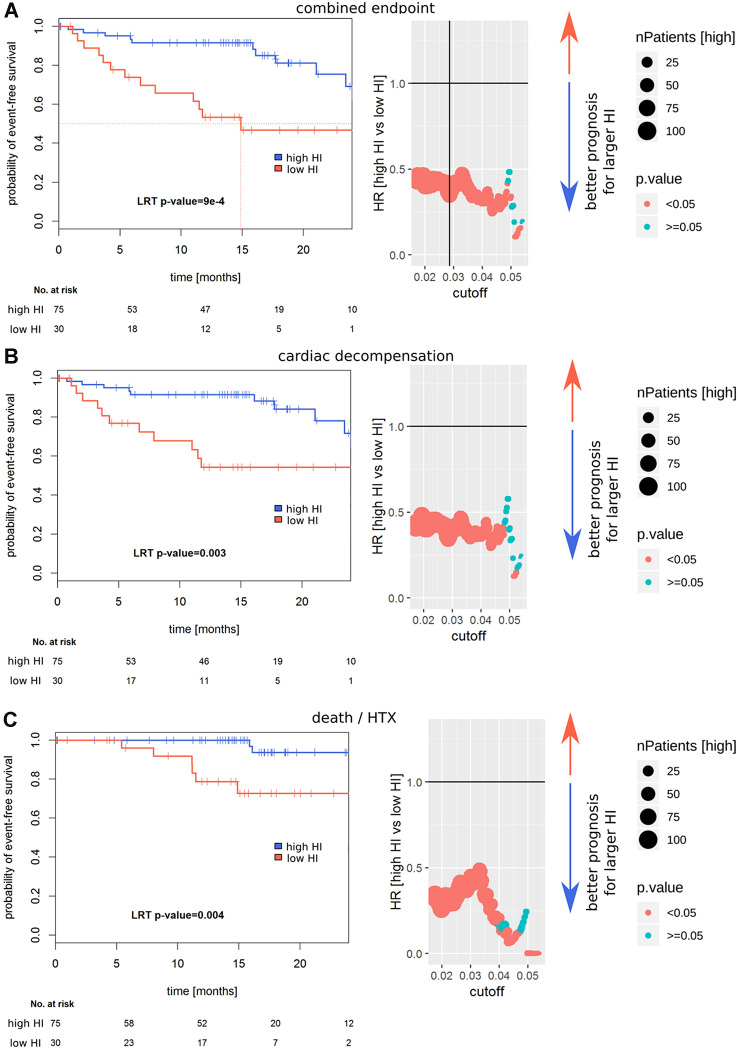
Fig. 2.
Prognostic value of HI. Left: Kaplan–Meier survival curves are shown; p values are calculated using a Cox-PH model. Right: Cutoff selection using Cox-PH models for the separation of prognostically different groups, the vertical line in a indicates the further utilized cutoff. Wald p values are reported. In a the combined endpoint (death, cardiac transplantation or decompensation), in b the endpoint decompensation and in c the endpoint death or HTX are depicted

