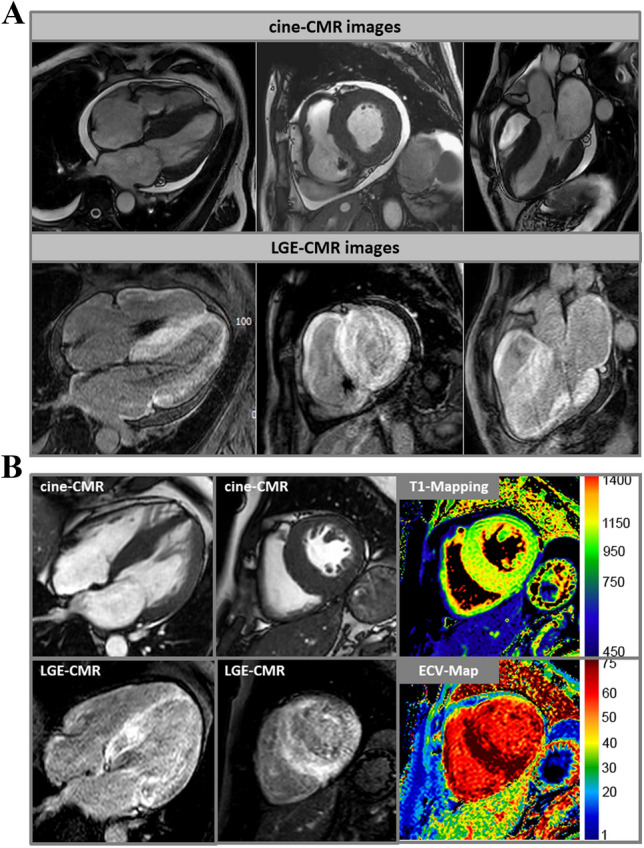
Fig. 2.

a Cardiovascular magnetic resonance (CMR) images of a patient with cardiac amyloidosis and a DDD pacemaker. In the upper row, cine images are shown in a 4-chamber view, in the short axis, and in a 3-chamber view. In the lower series, the corresponding contrast images (“late gadolinium enhancement” [LGE]) are shown with evidence of diffuse LGE in all heart cavities and myocardial sections. b In addition to the cine and LGE images, T1 mapping and ECV (extracellular volume fraction) images are shown in the right column. Particularly in the basal septum, measured values of T1 (native) = 1300 ms and ECV = 70% were significantly increased and characteristic for cardiac amyloidosis
