
Figure 1S.
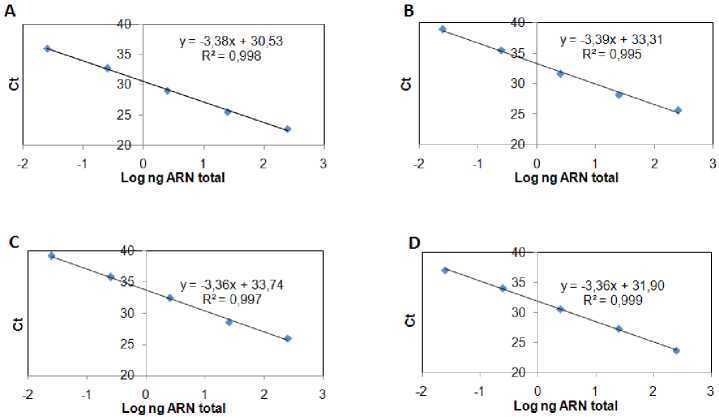
Efficiency of gene amplification. qPCR amplification efficiencies of α-tubulin, defensin A, and cecropin A genes. Each gene DNA was diluted in serial 10-fold ranges and the cycle threshold (Ct) value at each dilution was measured. The Ct represents the average of two independent experiments done by triplicate. Then, a curve was obtained for: a) α-tubulin, b) defensin A or c) cecropin A gene from which qPCR efficiencies (E) were assessed. The slopes of the curves were used to calculate E according to the equation: E = 10(-1/slope) - 1 × 100, where E = 100 corresponds to a 100% efficiency.
The amplification efficiencies obtained for the genes after applying the equation were:
A) α-tubulin gene, 97.3%
B) defensin A gene, 97.2%
C) cecropin A gene, 98.5%