
Figure 2S.
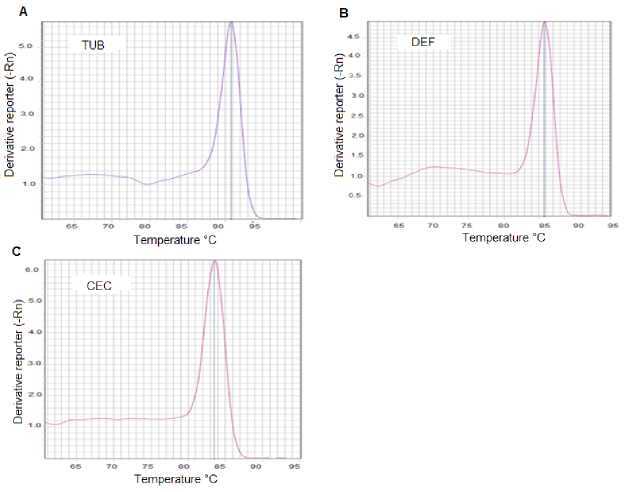
DNA qPCR melting curve analysis for the detection of gene specificity. Three fragments, the first from the α-tubulin gene, the second from the defensin A, and the last from the cecropin A gene were synthesized by qPCR using specific primers for each gene. The resulting products were subjected to post-PCR melt analysis. Only one peak was detected with primers for A) α-tubulin gene; B) defensin A gene or C) cecropin A gene.